


The risk-off tone that kicked off the week continued to make waves on Tuesday, sending commodities and yields lower, although Wall Street indices remain reluctant to fully roll over. We are now approaching a binary data point from the US today via the ISM services report. Given the risk-off tone struck by Monday's manufacturing counterpart, we may get a more volatile reaction today, as services are arguably the more important read of the two due to their increased role in the economy.
The question is whether we will see an extension of the risk-off sentiment or a reversal of Monday's moves – provided ISM comes in hot enough to quash hopes of Fed cuts and deem the manufacturing print a false flag. Either way, it seems we are waiting for the US dollar to break out of the tight range between the 104 handle and the 200-day average. My guess is that we will see that today.
One-day implied volatility has perked up for USD/CAD, USD/CHF, and USD/JPY. The Swiss franc continues to weaken following the SNB's warning of currency intervention to ward off bears. It seems to be working. The Canadian dollar is likely to be caught in the crossfire of today's Bank of Canada (BOC) cash rate decision and the ISM services report, which occur within 15 minutes of each other.
There is well-grounded speculation that the BOC could hike rates. However, if they do, I doubt they will signal further hikes today. This could see CAD bears unwind, which could send USD/CAD sharply higher if ISM data comes in hot.

Economic events (GMT+1)
- 08:55 – German final PMIs
- 09:00 – Eurozone final PMIs
- 09:30 – UK final PMIs
- 10:00 – Eurozone PPI
- 13:15 – US ADP employment
- 12:45 – US final PMIs
- 12:45 – BOC cash rate decision, statement
- 15:00 – ISM services PMI

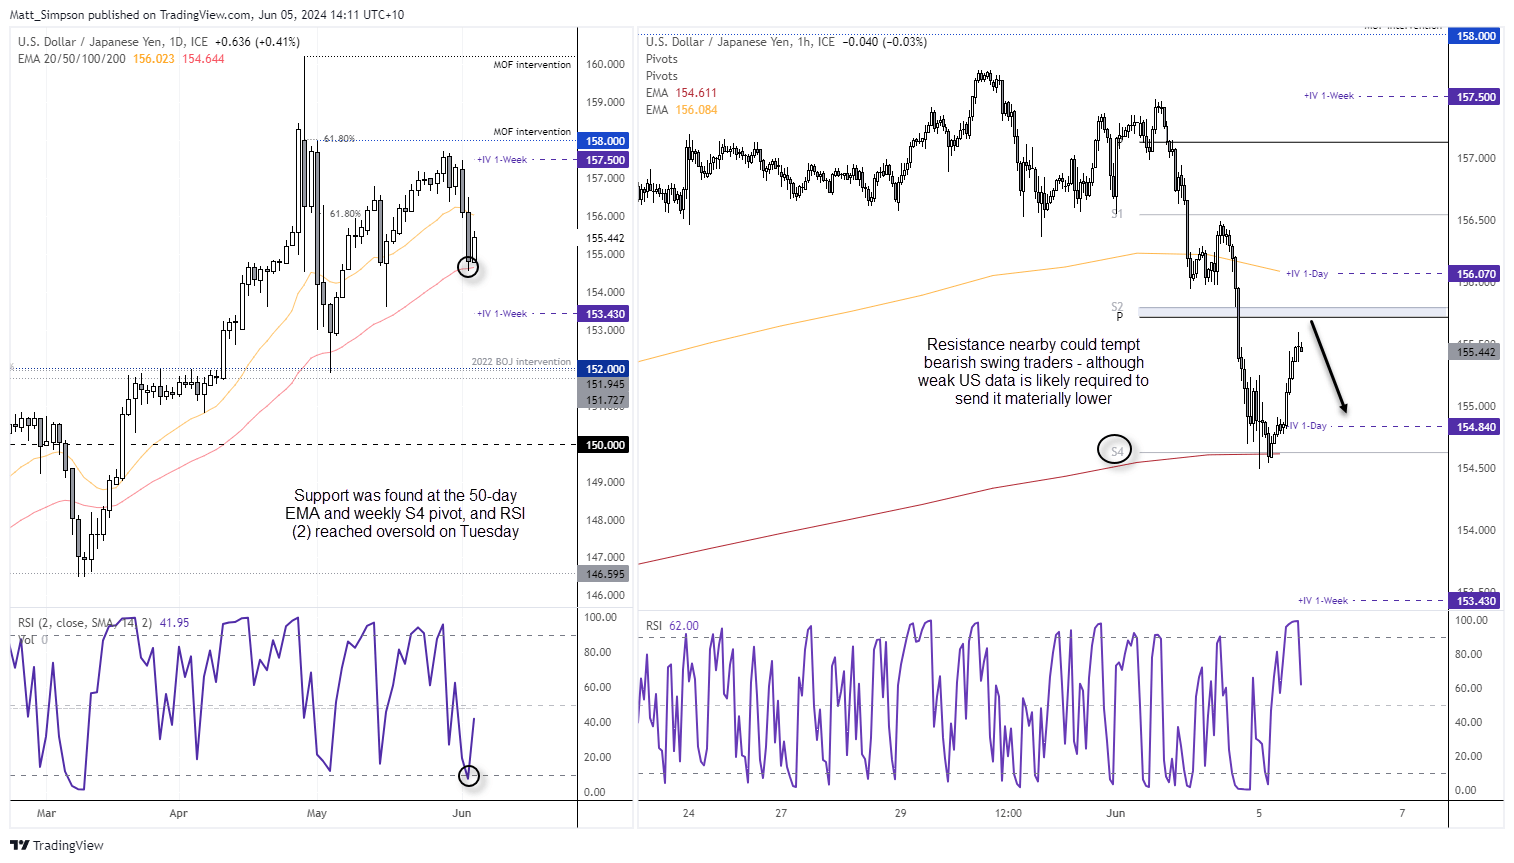
USD/JPY technical analysis:
USD/JPY fell -1.6% over the past two days, which was its worst 2-day losses since May 2nd. Yet support was and hand to prompt a corrective bounce in today’s Asian session, including the 50-day EMA and weekly S4 pivot. The fact that it reached the S4 level just two days into the week itself shows how stretched the move was, with the daily RSI (2) reaching oversold being the icing on the cake.
The question now is where from here? And that is almost certainly down to how today’s IMS services report fares, with a strong headline figure alongside elevated ‘prices paid’ likely to support US yields and the USD, and send USD/JPY higher in the process. Yet if ISM services remains below 50 and prices paid softens, USD/JPY looks primed to drop.
The monthly pivot point and weekly S2 sit just beneath 155.80, and could become a pivotal level ahead of the report.
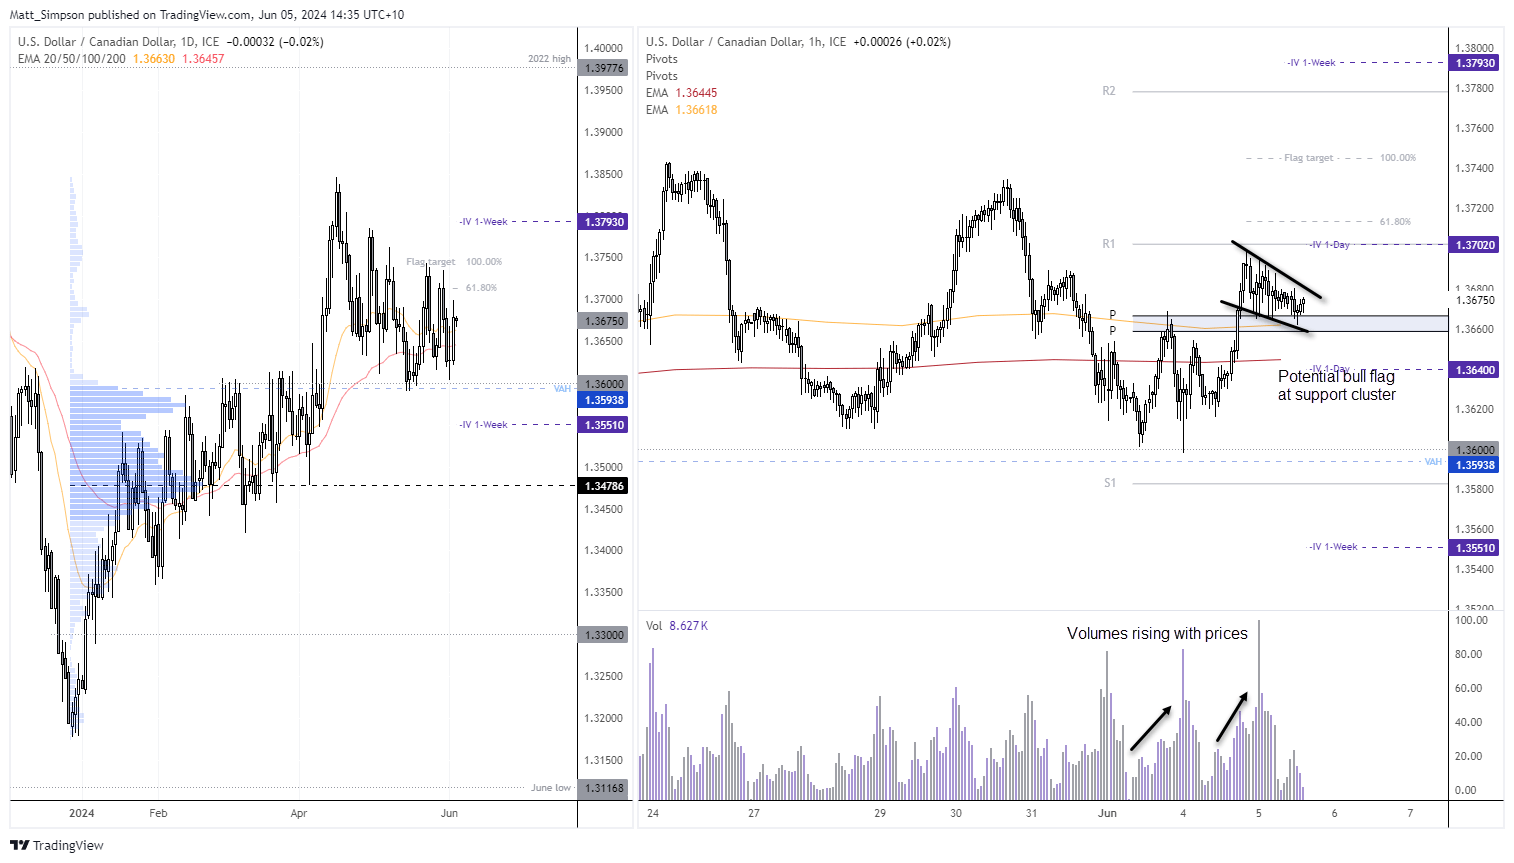
USD/CAD technical analysis:
Price action on USD/CAD has been both frustrating but impressive at the same time. The daily chart shows lots of overlap which is sure to have frustrated position traders on this timeframe or above, it its direction is fickle at the best of times. Yet the pair has done a great job of holding above the 1.360 handle near the VAH (value area high) of the prior rally. And a ‘gun to head’ analysis favours USD/CAD to break above last week’s highs before it retests 1.36.
These choppy, overlapping daily candles have provided some clean moves on the 1-hour timeframe. We just best not expect such moves to last for more than a day or session at a time. A bull flag is forming just above the weekly and monthly pivot points and 20-day EMA, which suggests an upside break leading into the ISM report.
The 1-day implied volatility level seems quite narrow considering we have a BOC meeting on tap, and given it is within 15 minutes of the ISM report then volatility is expected. And I suspect we’ll see a larger move than the 1-day IV band implies.
View the full economic calendar
-- Written by Matt Simpson
Follow Matt on Twitter @cLeverEdge
How to trade with City Index
You can trade with City Index by following these four easy steps:
-
Open an account, or log in if you’re already a customer
• Open an account in the UK
• Open an account in Australia
• Open an account in Singapore
- Search for the market you want to trade in our award-winning platform
- Choose your position and size, and your stop and limit levels
- Place the trade
Latest market news
Yesterday 07:26 PM
Yesterday 05:35 PM
Yesterday 04:15 PM
Yesterday 11:30 AM
Latest Trade Ideas articles

Yesterday 07:26 PM

Yesterday 05:35 PM


Yesterday 04:15 PM