


US CPI Key Points
- Traders and economists expect the US CPI report to fall to 3.1% y/y on a headline basis, with the “Core” (ex-food and -energy) reading expected to hold steady at 3.4% y/y.
- This week’s US CPI report is unlikely to have an immediate impact on monetary policy, but it will still shape the Fed’s longer-term progress toward achieving its dual mandate.
- Traders will be looking to buy S&P 500 dips back toward support at 5,500.
When is the US CPI Report?
The June US CPI report will be released at 8:30am ET on Thursday, July 11, 2024.
What are the US CPI Report Expectations?
Traders and economists expect the US CPI report to fall to 3.1% y/y on a headline basis, with the “Core” (ex-food and -energy) reading expected to hold steady at 3.4% y/y.
US CPI Forecast
In the wake of Friday’s mixed NFP report (slight beat on headline jobs, but with a larger negative revision to past reports and an uptick in the unemployment rate), the Federal Reserve looks highly unlikely to cut interest rates this summer; indeed, the odds of an interest rate cut before September have fallen to just 5% per the CME’s FedWatch tool.
Against that backdrop, this week’s US CPI report is unlikely to have an immediate impact on monetary policy, but it will still shape the Fed’s longer-term progress toward achieving its dual mandate
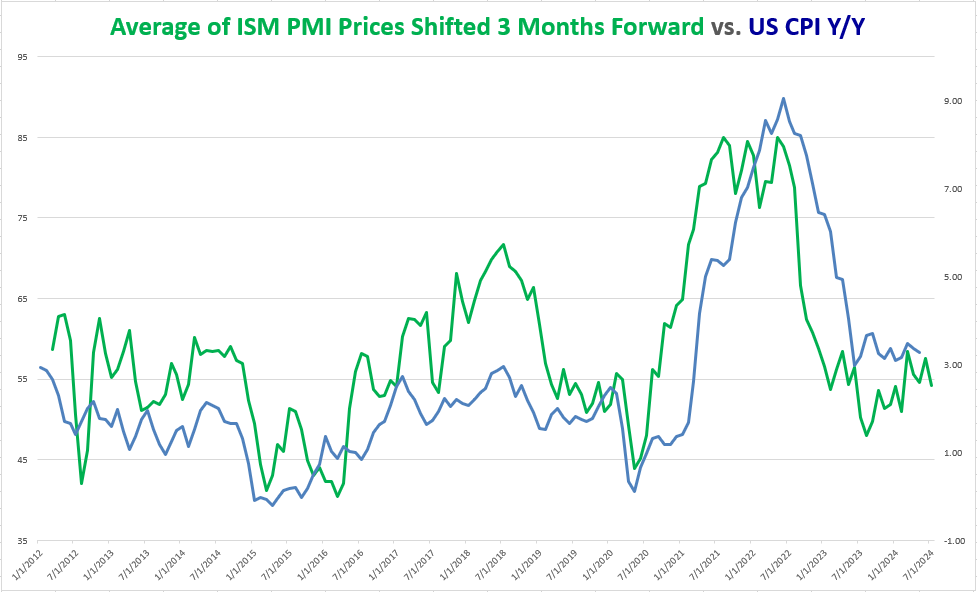
As many readers know, the Fed technically focuses on a different measure of inflation, Core PCE, when setting its policy, but for traders, the CPI report is at least as significant because it’s released weeks earlier. As the chart below shows, the year-over-year measure of US CPI has flatlined around 3.3% for an entire year now, and one of the best leading indicators for future CPI readings, the ISM PMI Prices component, has stopped falling and is holding steady in the mid-50s in recent months:
Source: TradingView, StoneX
As the chart above shows, the “Prices” component of the PMI reports rose from below 50 in the latter half of last year to near 60 in the first quarter of this year, but mirroring the slowdown in other aspects of the US economy, has held steady in the mid-50s since then.
With Fed Chairman Powell noting earlier this week that he and his Federal Reserve colleagues are looking for “greater confidence” that inflation is well and truly beat, they’ll no doubt be hoping that the ISM “Prices” components will continue to fall from here, dragging CPI down along with it. For this week’s report though, more of the same low-3% y/y inflation is likely.

S&P 500 Technical Analysis – SPX Daily Chart
Source: TradingView, StoneX
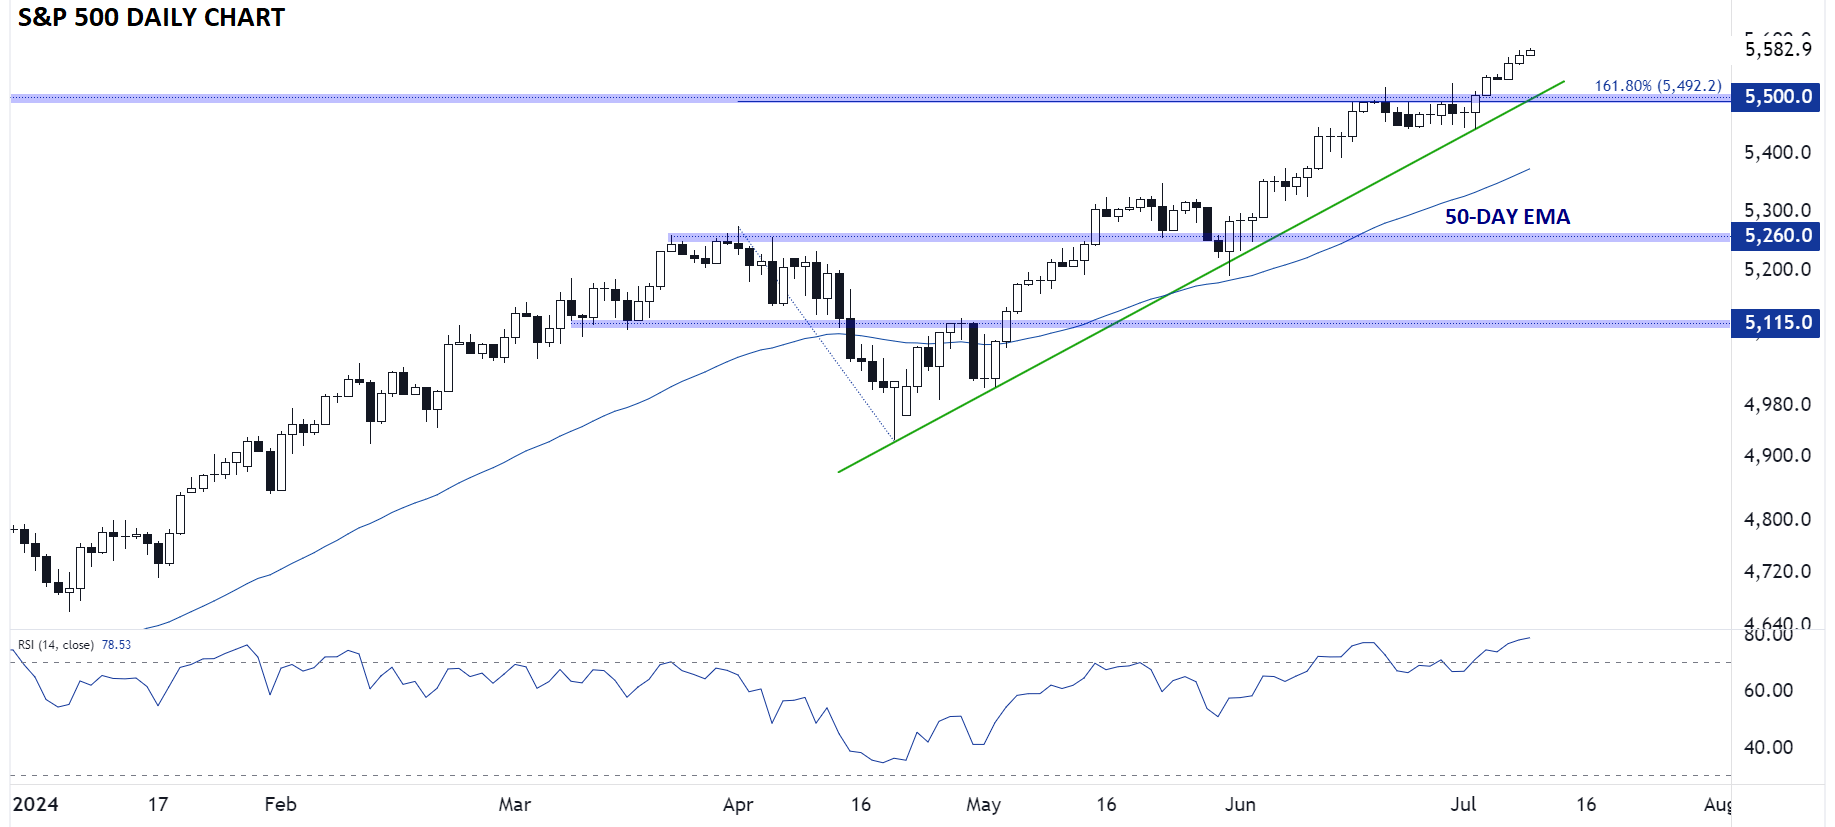
Indices across the globe have extended their rallies in recent weeks, boosted by optimism over imminent monetary policy easing and (especially in the US) the transformative potential of AI. As the chart above shows, the index is on track to set its third consecutive record closing high since breaking above 5,500 resistance last week.
For contrarian traders, or perhaps just bulls looking for a better entry, it is notable that the 14-day RSI is currently above 78, its highest reading so far this year. While not necessarily indicative of an immediate reversal, the indicator is in overbought territory, raising the risk of a near-term pullback. If we do see a brief dip, the key area to watch will be around the aforementioned 5,500 level, where the bullish trend line off the April lows coincides with key previous-resistance-turned-support. Only a break below that level would erase the near-term bullish bias in the index.
-- Written by Matt Weller, Global Head of Research
Check out Matt’s Daily Market Update videos on YouTube and be sure to follow Matt on Twitter: @MWellerFX
Latest market news
Latest SPX 500 articles


February 3, 2025 02:08 PM

February 2, 2025 08:00 AM
January 31, 2025 02:18 PM