


China A50 technical analysis:
The 22% rally from the January low to May high confirmed that the China A50 had entered a bull market which is defined by a 20% move higher from the prior low). I should add it seems to be quite common for markets to retrace after 20% moves, amid headlines of technical bulls or bear markets. But as the rally had occurred in a relatively straight line and 13k loomed, a pullback was arguably needed.
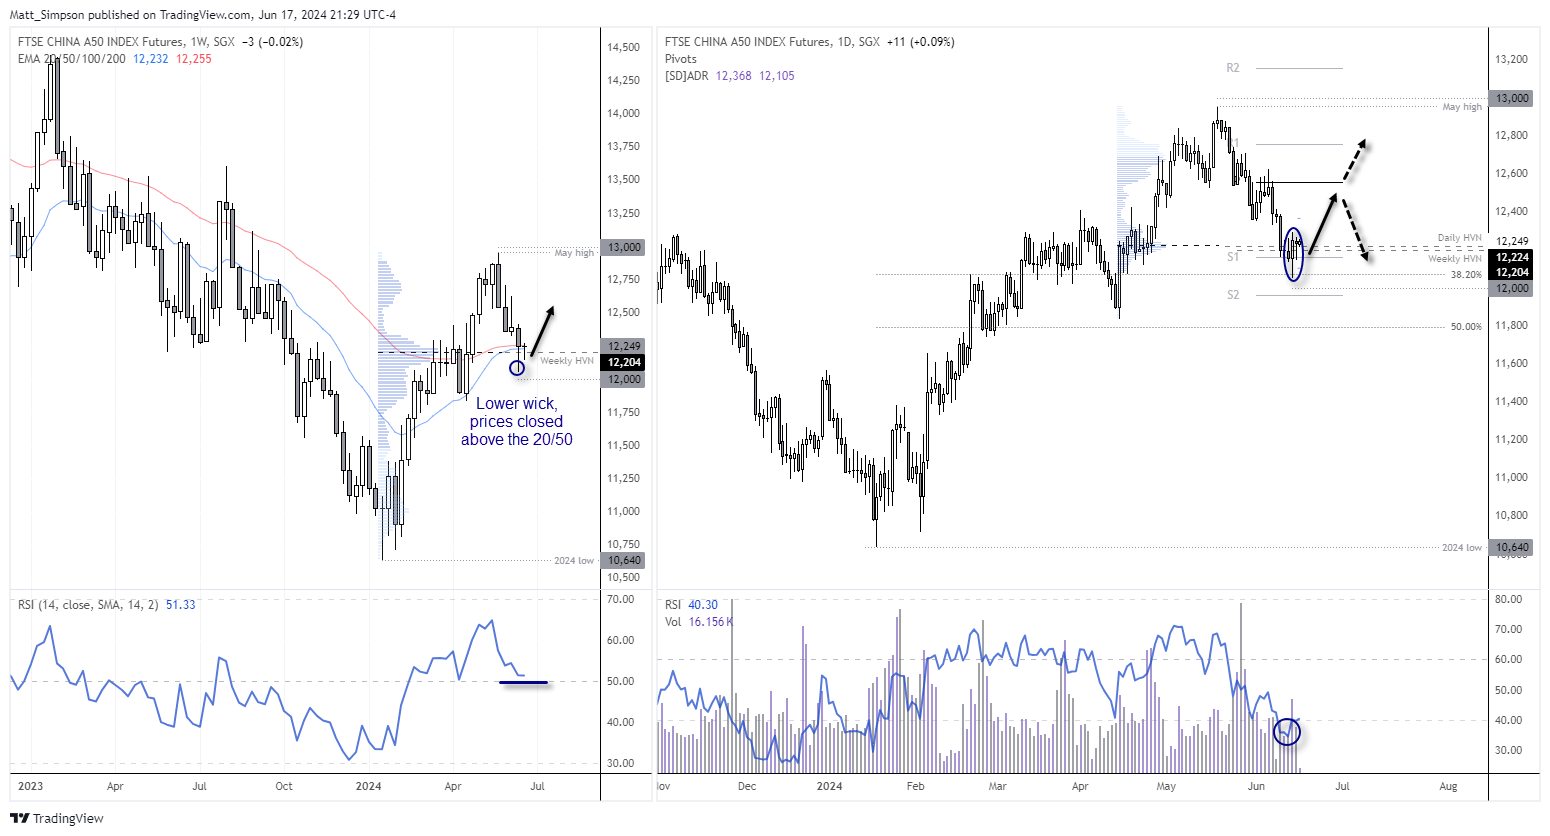
Four months later and a 7% decline late, I suspect the China A50 is at or near another inflection point. Last week closed on the 20 and 50-week EMAs and back above a high-volume node (HVN) from the prior rally on the weekly chart. The lower wick also accounted for around half of last week’s range, which suggests bears are running out of steam. The weekly RSI (5o) also remains above 50 to show positive momentum overall.
The daily chart shows a bullish engulfing candle formed on Friday almost perfectly at a 38.2% Fibonacci ratio with high volume. Prices also recovered back above a weekly and daily HVN, closed above the monthly S1 pivot and RSI (14) reached oversold (which can be below 40 during an uptrend). Bulls also have the 12k handle nearby, should prices dip lower from here before the next anticipated leg higher.

Nikkei 225 technical analysis:
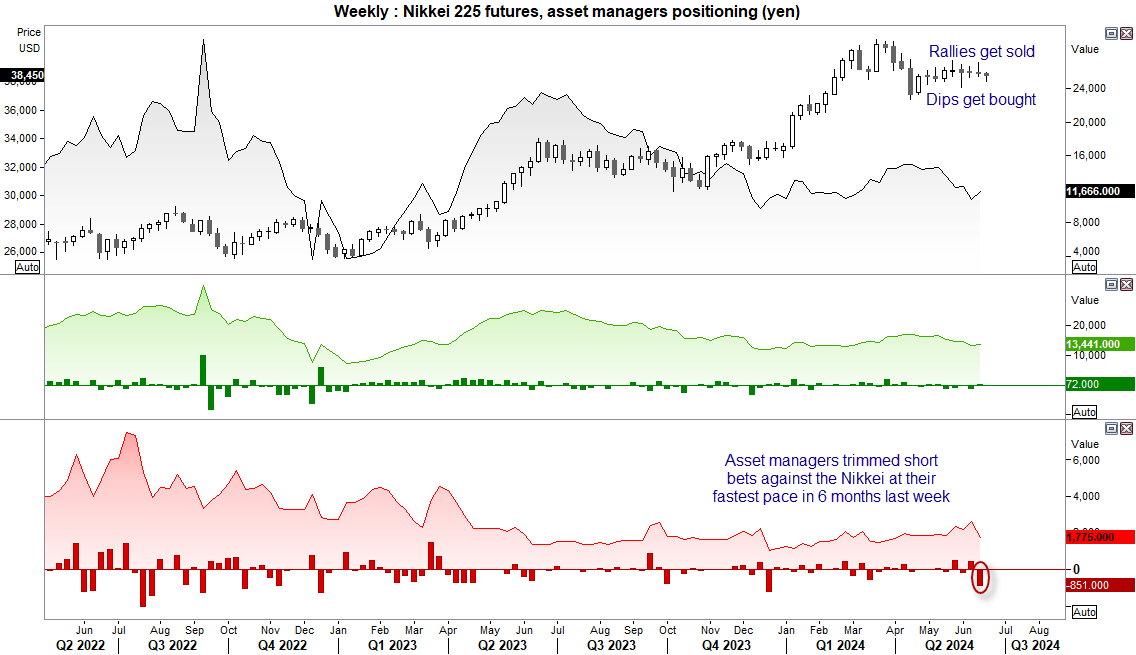
I recently outlined a bearish scenario for the Nikkei 225, where an ABC correction could potentially see the index fall to 35k. A major part of the thesis is that Nikkei has repeatedly struggle to hold on to gains above 39k and is followed with a move lower. Yet what also seems to be supporting the index is the 20-week EMA and the Nasdaq 100 repeatedly printing record highs. In all the time the Nasdaq remains supported and the yen remains weak, a move to 35k seems unlikely. I have also noted that asset managed closed gross-short exposure to Nikkei futures (in yen) at their fastest pace in six months last week. Bears may therefore be best to wait for moves towards 38 or 39k before seeking fresh shorts, with the 20-week / 100-day EMA neaby for potential support. But whilst 39k continues to cap as resistance, it remains a level for bears to consider fading into.
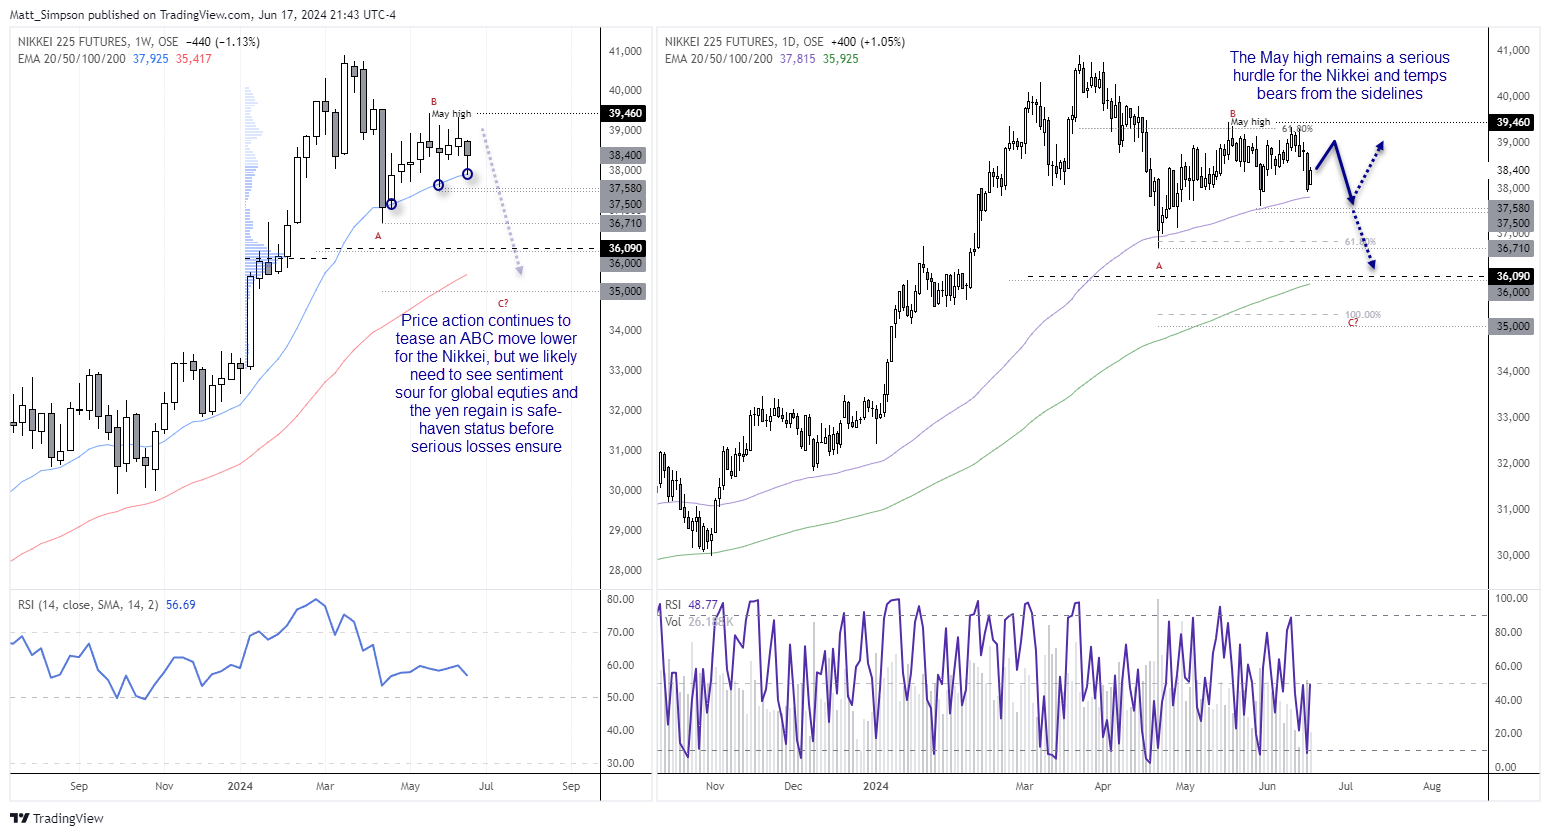
Of course, should sentiment for global equity markets sour and the yen regain traction as a safe-haven currency, the Nikkei would be my preference for a short given the corrective price action seen since the 36.7k low. Until them bears can fade into highs and bull step in around lows.
-- Written by Matt Simpson
Follow Matt on Twitter @cLeverEdge
How to trade with City Index
You can trade with City Index by following these four easy steps:
-
Open an account, or log in if you’re already a customer
• Open an account in the UK
• Open an account in Australia
• Open an account in Singapore
- Search for the market you want to trade in our award-winning platform
- Choose your position and size, and your stop and limit levels
- Place the trade
Latest market news
Today 09:44 AM
Today 09:34 AM
Yesterday 07:55 PM
Yesterday 05:30 PM
Latest Trade Ideas articles

Today 09:44 AM

Yesterday 07:55 PM

Yesterday 05:30 PM

Yesterday 05:06 PM