
The RBA are unlikely to change policy any time soon, however...
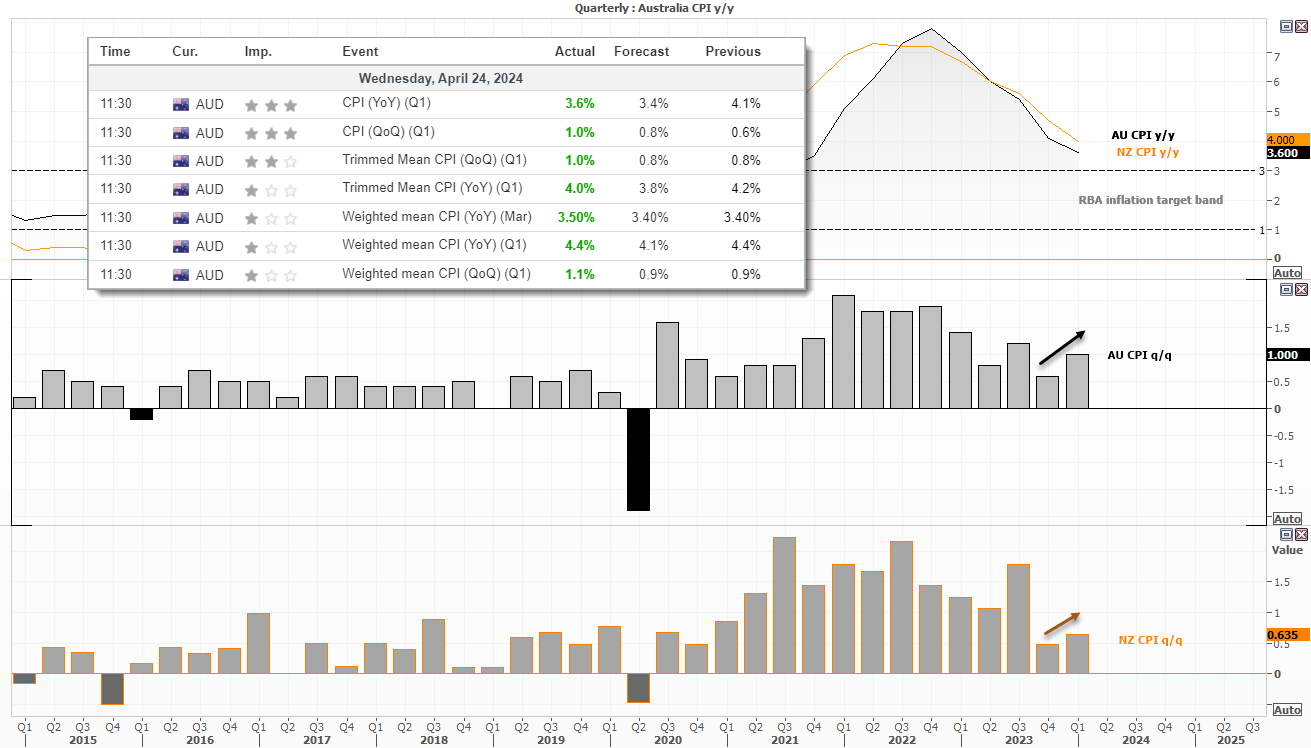
Regular readers should remember my stance on the RBA’s cash rate; it is unlikely to change for the remainder of the year. But that doesn’t mean things cannot change. Q1 inflation data was broadly above expectations which is the last thing the RBA (or anyone, for the matter) want so see. Especially when prices were already deemed “too high” by the RBA at prior meetings.
The basic theme for Q1 inflation was that it had slowed from Q4 on an annual basis yet was above economic forecasts, yet the q/q figures were above previous and economic forecasts. And if that trend persists, another hike cannot be ruled out.
But the RBA have warning of ‘upside risks’ for some time. And as inflation had previously cooled over multiple quarters, we must also expect some bumps in the road. Besides, consumers remain pessimistic according to Westpac which is backed up by weaker retail sales. And that suggests the cash rate of 4.35% is clearly dampening the economy to a degree. Furthermore, with the Fed closing the door on further hikes it also removes an element of pressure for the RBA to revert to the hawkish side for now (even though a hawkish bias may return in the statement). I therefore doubt a knee-jerk reaction from the RBA at Tuesday’s meeting. Even if market pricing is toying with the idea of one more hike by October.

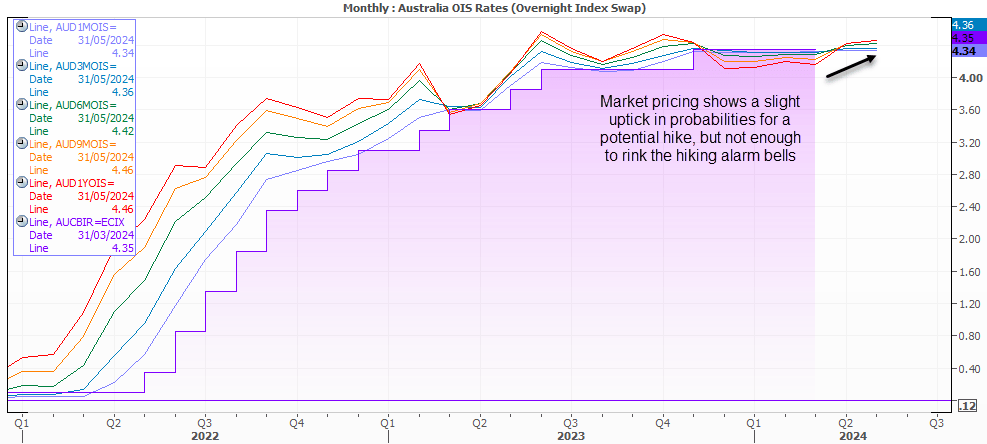
Market pricing shows that expectations for a potential hike have risen, but only gradually.
- The 30-day RBA cash rate futures contract implied a 5% chance of a 25bp increase by May 1st
- The yield tops at 4.45% in October 2024 and falls to 4.16% by October 2025
- The OIS curve has increased to show a slight increase of perceived probability of an RBA hike.
- But alarm bells are hardly ringing, with the 1-year OIS implying sitting just 11bp above the cash rate (to suggest less than the usual 25bp hike)

Eyes on the RBA’s updated forecasts
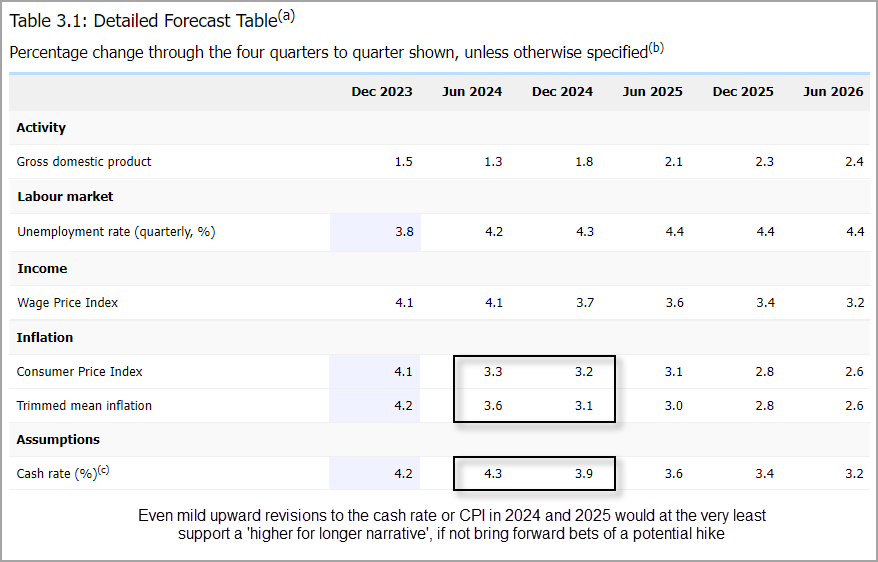
However, the RBA will also release their quarterly SOMP (Statement on Monetary Policy) which will include updated staff forecasts. And that can quickly reshape expectations for the rest of the year. We know the RBA lack the appetite to cut rates any time soon, but given the higher levels of inflation a key thing to look out for is upward revisions to the RBA’s cash rate forecast and CPI forecasts.

To summarise the February SOMP:
- Overall demand is still greater than supply, but the economy is moving towards a better balance
- Economic growth is expected to slow here and overseas
- Labour market conditions are expected to ease further
- Inflation is expected to decline to the 2–3 per cent target range in 2025 and to reach the midpoint in 2026
- While there are encouraging signs, the economic outlook is uncertain and the Board expects it will be some time before inflation is sustainably low and stable
AUD/USD futures – market positioning from the COT report:
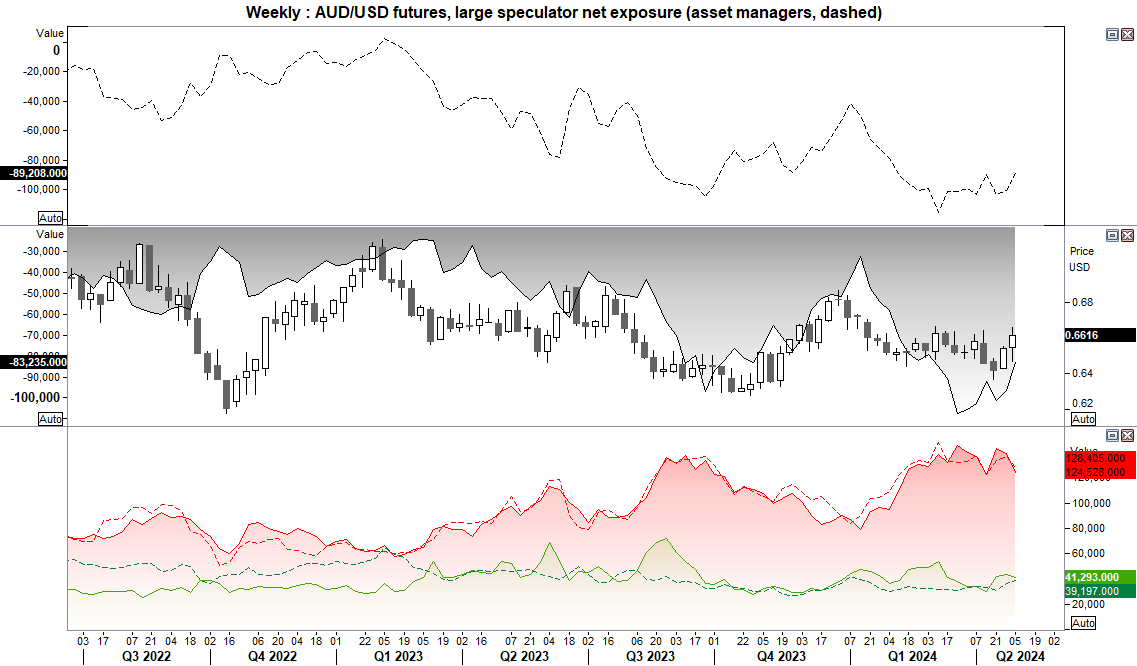
Bears continued to cover which allowed AUD/USD to rise for a second consecutive week. A hotter CPI report for Australia, and a weaker US dollar via weaker US economic data and the Fed closing the door on further hikes sealed the deal for risk appetite.
NZD/USD and AUD/USD were the strongest majors last, Wall Street rallied on Friday which saw SPI 200 futures track higher during out-of-hours trade. And this paints a positive start for the ASX 200 this week.

- Net-short exposure for large speculators and asset managers fell for a second consecutive week
- The weekly fall in net-short exposure fell at its fastest pace since September 2022 among large specs
- Asset manages trimmed shorts and increased longs, whereas large specs trimmed longs and shorts
- AUD/USD rose for a second week and closed above 66c
AUD/USD technical analysis
I was clearly wrong-footed last week seeking another dip lower for AUD/USD, as it rallied for three consecutive days into Friday’s close, thanks to weaker US economic data and the Fed closing the door on another hike.
Bulls made good progress with a firm close above the 200-day EMA and 66c handle. But can it make such easy work of the highs around the Q3 open?
The high tail on Friday is due to the US dollar recouping some of its losses in the second half of Friday’s NY session. And that suggest a hesitancy to test the Q3 open for now. So we may be in for some choppy trade between the 200-day EMA ~0.6560 and the Q3 open at 0.6660 as markets await the outcome of the RBA meeting. Should the RBA not be as hawkish as suspected, the perhaps the rally could peter out.
But a combination of a hawkish RBA and risk-on rally for global equities could send AUD/USD towards and potentially through the 0.6700 handle. I doubt we’ll see such a move ahead of Tuesday’s RBA meeting. And if the US dollar regains its footing then the upside potential for AUD/USD is likely to be capped.

-- Written by Matt Simpson
Follow Matt on Twitter @cLeverEdge
How to trade with City Index
You can trade with City Index by following these four easy steps:
-
Open an account, or log in if you’re already a customer
• Open an account in the UK
• Open an account in Australia
• Open an account in Singapore
- Search for the market you want to trade in our award-winning platform
- Choose your position and size, and your stop and limit levels
- Place the trade


