


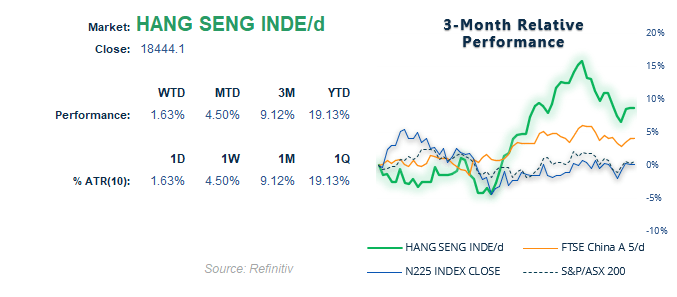
The Hang Seng has been the outperformer over the past three months, although all four major indices we track have pulled back from their May highs. With a month's worth of retracement behind them, perhaps there is some room for upside, at least over the near term.
There was a time when the Hang Seng shared a positive correlation with the CNH/HKD exchange rate, but this relationship appears to have broken down in Q4. No correlation is perfect, and these relationships come and go. It is worth noting that the Hang Seng now shares a stronger correlation with USD/HKD, although the relationship is inverse.
USD/HKD, Hang Seng technical analysis:
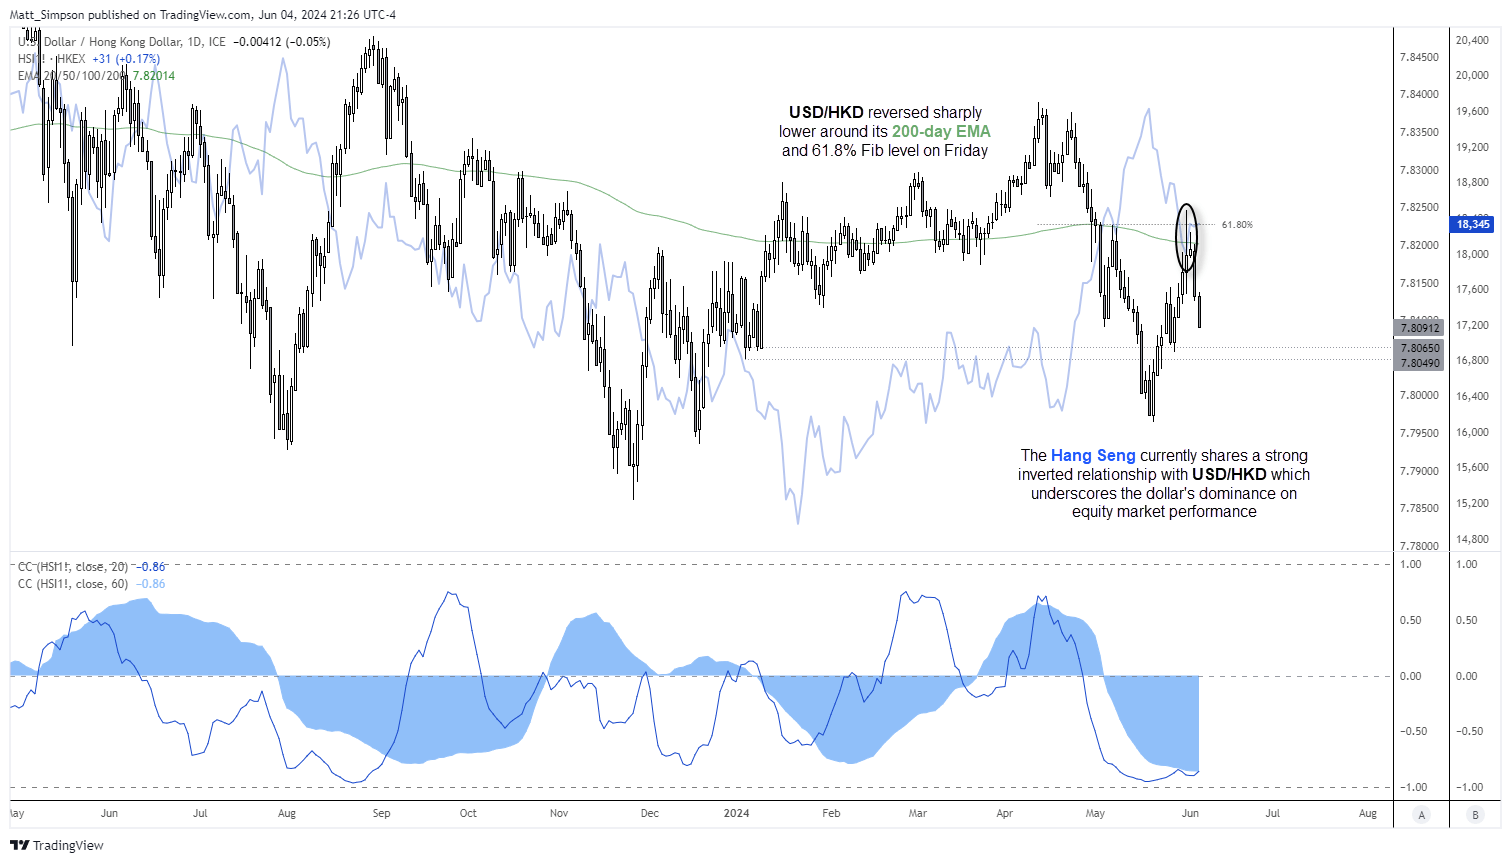
- The daily chart shows that the 60-day and 20-day correlation coefficient between USD/HKD and Hang Seng futures sits at -0.86, indicating a relatively strong inverse relationship.
- USD/HKD formed a prominent swing high around its 200-day EMA and 61.8% Fibonacci ratio on Monday, and momentum is turning swiftly lower.
- Should the US dollar continue to weaken and send USD/HKD lower, it could be beneficial for global sentiment and send the Hang Seng higher.
- However, if incoming US data comes in hot and sends the US dollar (and therefore USD/HKD) higher, it could weigh further on the Hang Seng.
- Swing lows around 7.805 might provide interim support and cap upside potential for the Hang Seng, unless the US dollar experiences a significant decline.

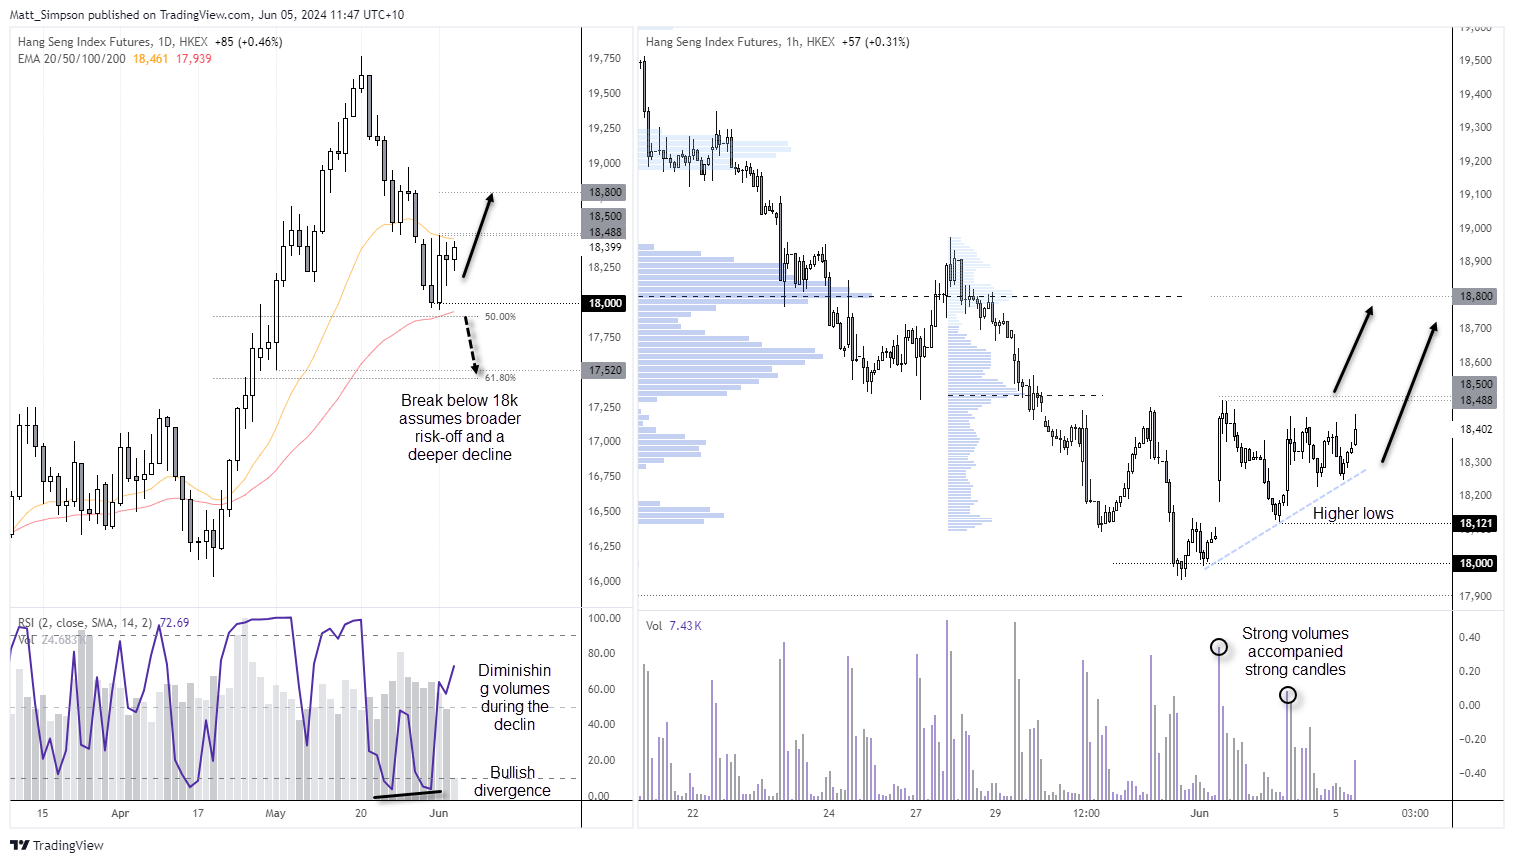
Hang Seng technical analysis:
Hang Seng futures are turning higher at the beginning of the session, while USD/HKD is heading lower. The daily chart shows that the 9.2% pullback from the May high found support at the 50-day EMA and 50% retracement level. Daily trading volumes were diminishing as prices moved lower, suggesting bears were running low on ammo in the later stages of the retracement. A bullish engulfing day formed on Monday, marking a false break below 18k, and subsequent trading ranges have remained in the upper half of the engulfing candle.
The 1-hour chart shows a series of higher lows accompanied by strong buying volumes. The bias, therefore, remains bullish while prices remain above Friday's swing low. Bulls could seek dips above 18k or wait for a break above 18,500.
Of course, should incoming US data come in uncomfortably strong and kill hopes of Fed cuts, it will likely have a dire impact on risk appetite, sending the US dollar and yields higher to the detriment of global indices. In which case, the bias reverts to a break below 18k, and prices could head to the 17,500 region.
-- Written by Matt Simpson
Follow Matt on Twitter @cLeverEdge
How to trade with City Index
You can trade with City Index by following these four easy steps:
-
Open an account, or log in if you’re already a customer
• Open an account in the UK
• Open an account in Australia
• Open an account in Singapore
- Search for the market you want to trade in our award-winning platform
- Choose your position and size, and your stop and limit levels
- Place the trade
Latest market news
Today 07:56 PM
Today 07:38 PM
Latest Trade Ideas articles


Today 07:56 PM

Today 07:38 PM
