


- Gold is retesting the lower border of a channel respected since October 2023
- Silver is retesting the mid-level of a channel respected since October 2023
- Gold Futures are flagging a decline in bullish volumes
What is a Bull Trap?
A bull trap occurs when the trend breaks out of a significant resistance level, luring bull traders in with a temporary price increase, only to steeply reverse back to the initial breakout level. Underlying reasons to get caught in bull traps include non-confirming momentum and volume indicators along the trend. These traps commonly occur in sideways ranges.
What Does This Have to Do with Gold and Silver Charts?
The steep bull trend of gold and silver charts last week, breaking back above levels 2340 and 30 respectively, faced a steep drop on Friday to wipe out weekly gains, dropping back towards Monday’s price range.
What’s Next for the Metals?
With the summer season here, the charts show a bias towards sideways movements. The charts between May and June indicate that consolidations are dominating the analysis.
Gold and Silver Forecast: Gold Futures - Weekly Time Frame - Logarithmic Scale

Unlike XAUUSD, gold futures failed to trace a significant new high in May, forming a resistant ceiling with the chart, along with a decline in bullish volumes.
What Does That Mean for XAUUSD?
Confirmation is needed to establish bullish scenarios
Gold and Silver Forecast: XAUUSD - Daily Time Frame – Logarithmic Scale
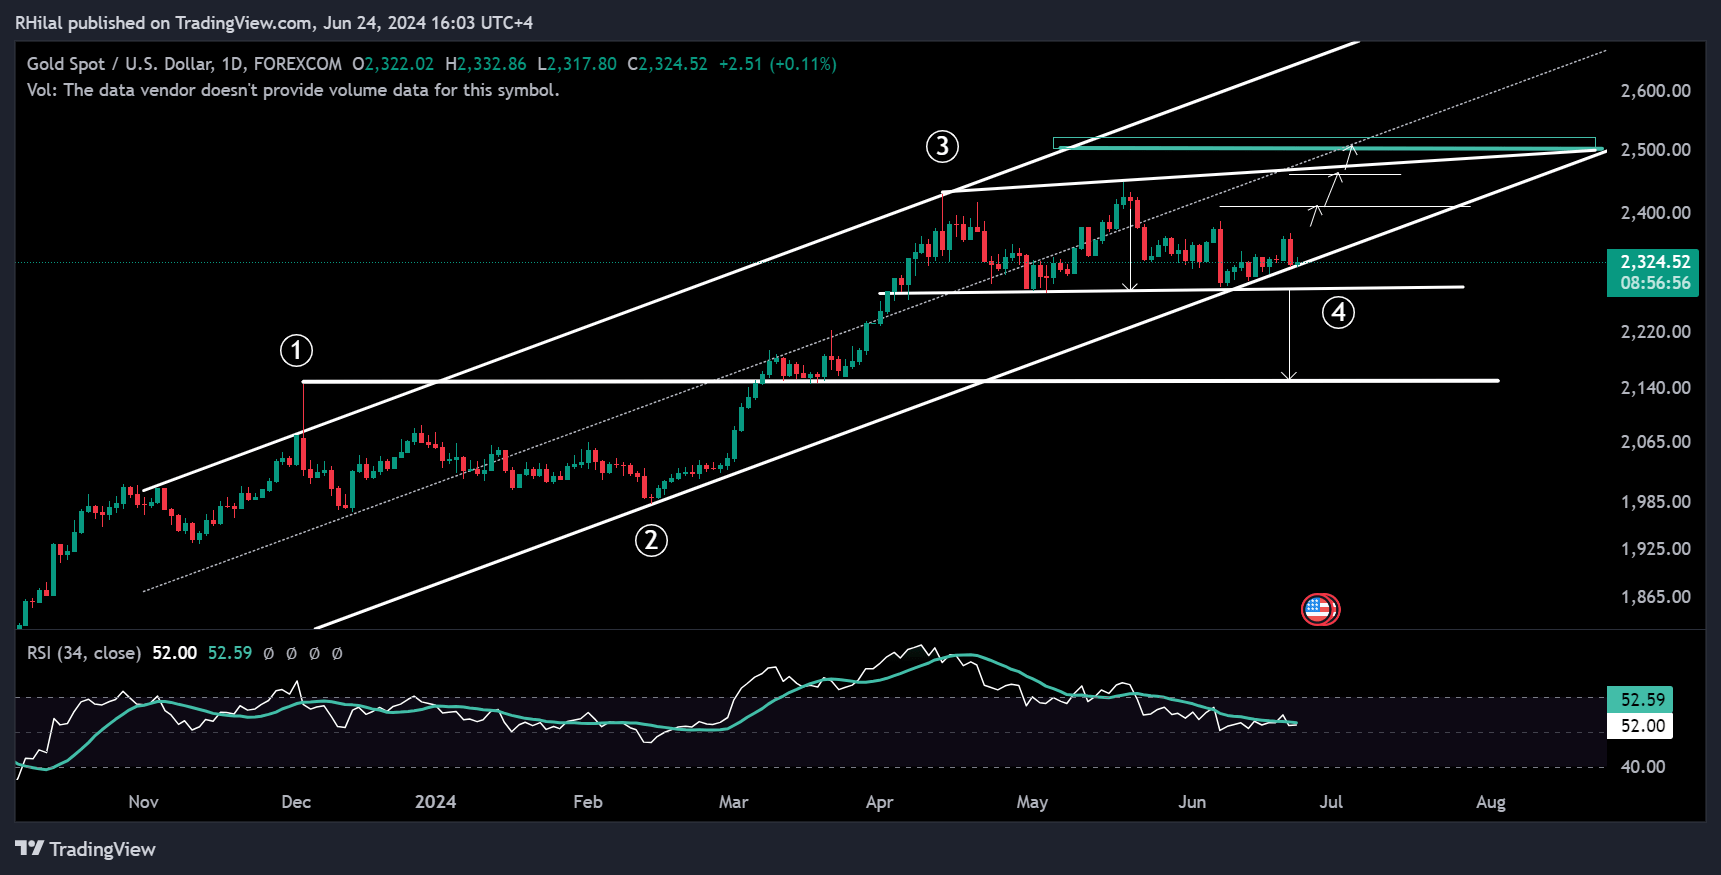
Gold is currently retesting the lower borders of a respected and up-trending parallel channel since October 2023. The latest consolidation between May and June left an indecisive forecast for the yellow metal.
Bearish scenario: a confirmed drop below the respected channel and the 2270 low can dominate a bearish trend towards the key level of 2150. This level aligns with the potential first wave spike of December 2023.
Bullish Scenario: a confirmed break above resistance levels 2410 and 2460 can meet the next potential resistance at the 2500 zone.
GOLD and Silver Forecast: XAGUSD - Daily Time Frame – Logarithmic Scale
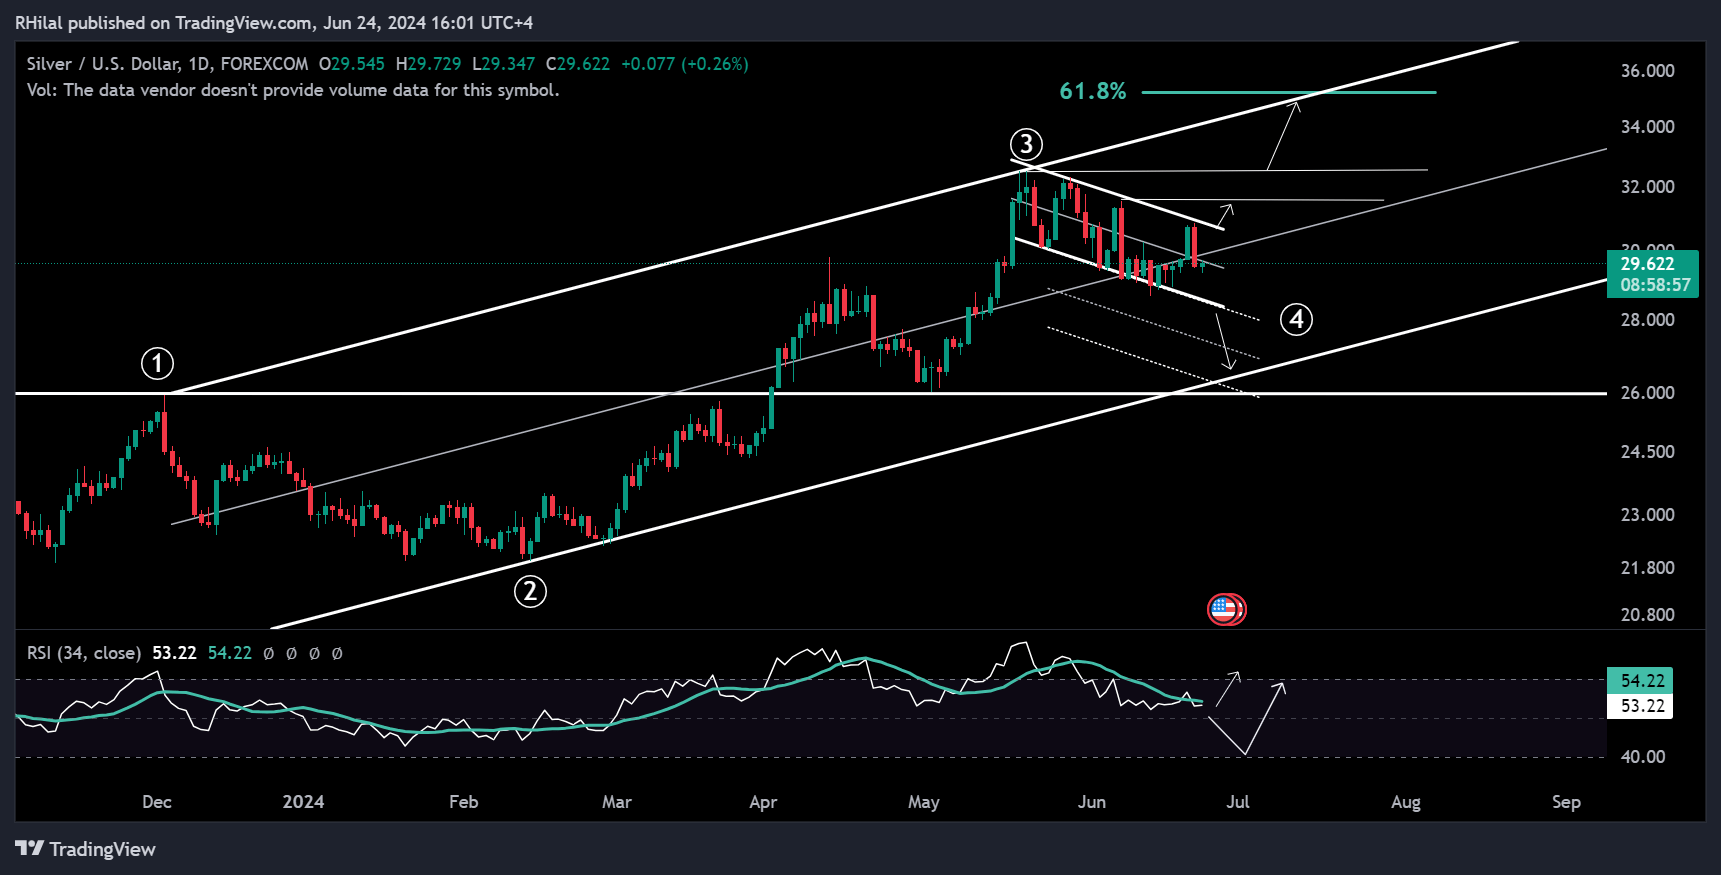
Silver has been trading within a declining range from the May 2024 highs, possibly forming a flag pattern. However, without confirming volume and momentum, breakouts beyond key levels are needed to confirm the following trend.
Bearish Scenario: a confirmed break below 28.50 can drag silver to the lower end of its primary trending channel, aligning with the previous wave 1 top at the 26 level.
Bullish Scenario: a confirmed break above the resistance levels 31.50 and 32.50 can support silver’s uptrend towards the upper end of its up-trending channel, targeting the next potential resistance level at the 35 zone.
The economic calendar’s indicator of the week is the Fed’s favored inflation gauge. The market is looking towards easing data in alignment with the Fed’s inflation rate target.
Until the fundamentals play out, the mentioned key levels with their confirming momentum and volume indicators can pave the way.
--- Written by Razan Hilal, CMT
Latest market news
Today 08:30 PM
Today 07:15 PM
Today 04:10 PM
Latest Gold articles


Yesterday 05:06 PM

Yesterday 04:00 PM

January 3, 2025 03:50 PM