


- DXY trend ahead of NFP
- EURUSD Analysis
- Crude Oil Analysis
This year, the DXY (U.S. Dollar Index) has largely respected the boundaries of its up trending parallel channel. Although it dipped below the channel once, it was swiftly boosted back by positive NFP (Non-Farm Payroll) results. However, after a week marked by contracting key indicators and below-expectation data, the DXY has again declined towards the lower border of its channel.
DXY - Daily Time Frame - Logarithmic Scale

From a relative strength perspective, the 4-hour RSI (14) is retesting its oversold zone, while the smoothed daily RSI is testing its neutral zone. Should momentum become exhausted ahead of the results, a potential bullish rebound may occur.
Linking the DXY’s chart to EURUSD’s trend

EURUSD Forecast: EURUSD - Daily Time Frame - Logarithmic Scale
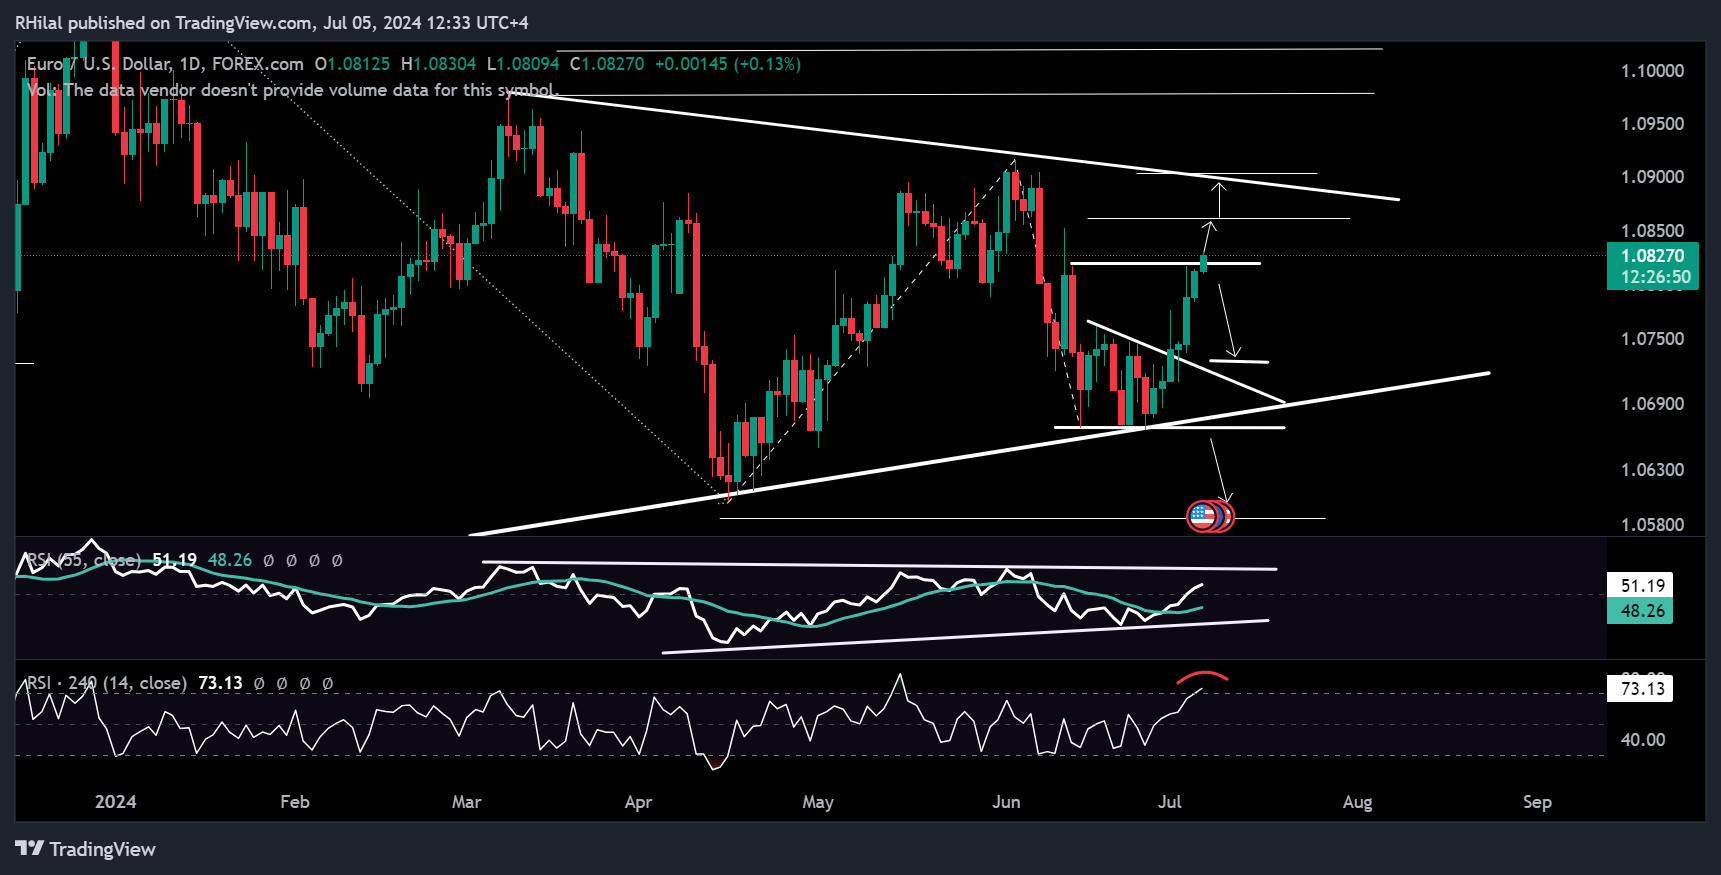
Breaking out of its minor triangle pattern, and surpassing its initial resistance at 1.0820, the EURUSD is now facing the upper boundary of its larger consolidation. The next potential resistance levels for the EURUSD are 1.0860, aligning with a 1.618 Fibonacci Extension derived from the April 2024 low, June 2024 high, and June 2024 low. The upper border of the consolidation could challenge the next uptrend near the 1.09-1.0915 zone, which aligns with the June high.
Following positive NFP results, a potential drop in EURUSD could hold near the support levels of 1.0770 and 1.0730. The 1.0670 remains a key level for a bearish analysis.
Crude Oil Analysis
Recent inventory data showed a -12.2-million-barrel change, reflecting increased demand at the start of the summer season. Despite this, oil remains below its key resistance level, aligning with the upper border of its key consolidation.

Crude Oil Forecast: USOIL – Daily Time Frame – Logarithmic Scale
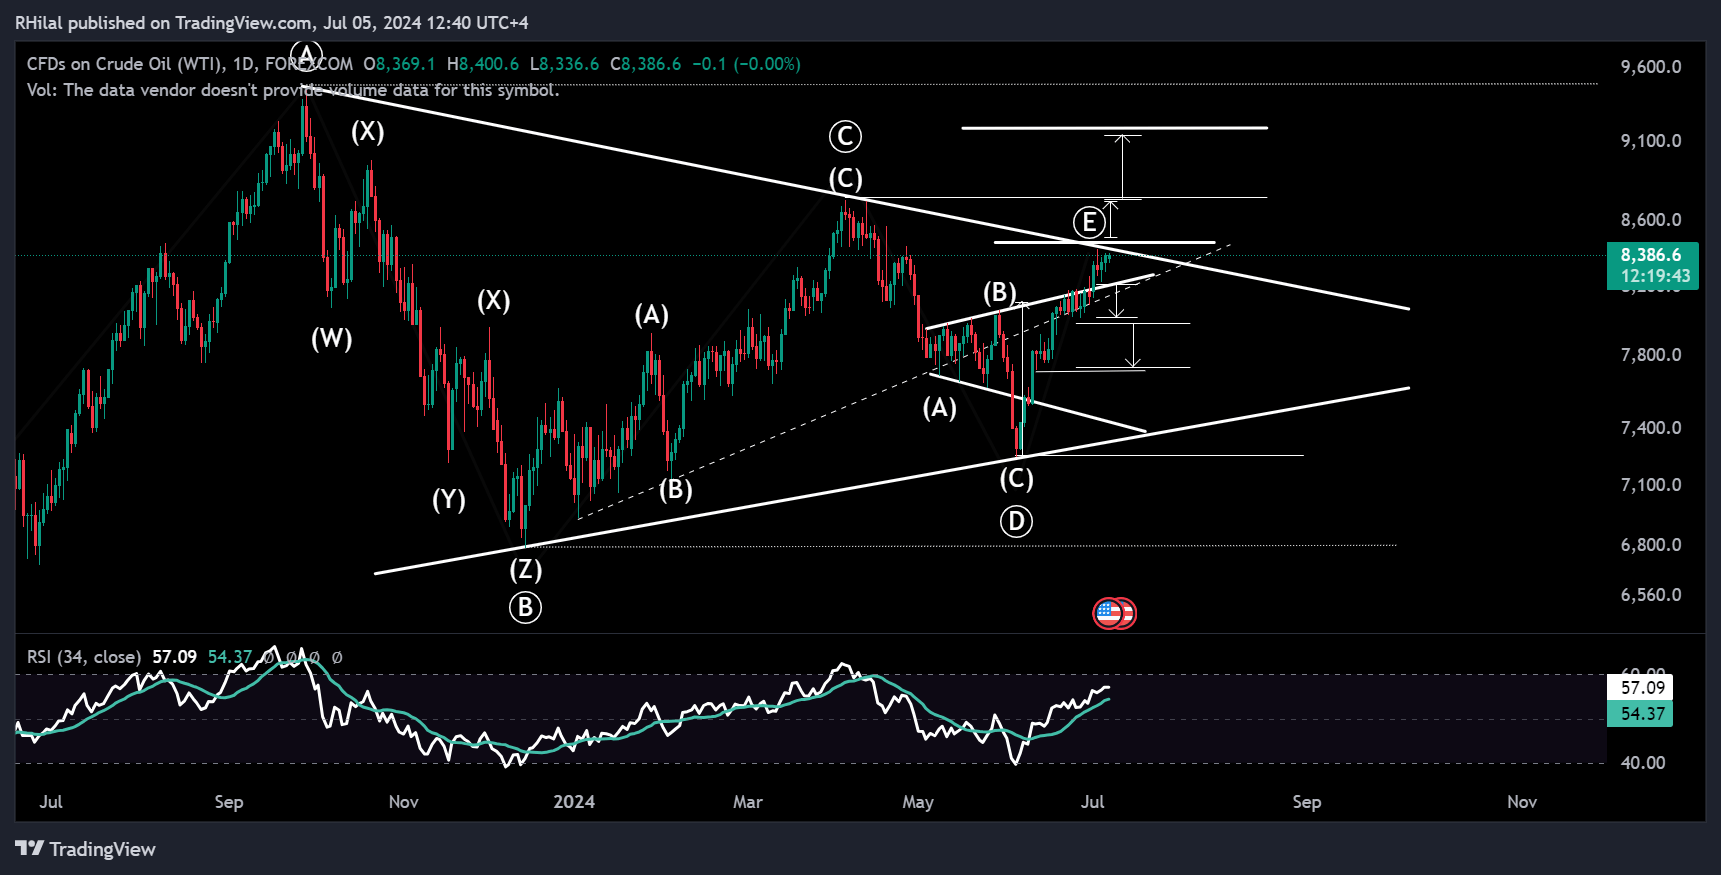
Oil is patiently holding below its key resistance zone at 85, respecting the triangle borders. The yearly high is the next target after a close above the 85 zone.
The support levels that could potentially hold a drop from the upper border are 81.80, 80, and 77.
Following negative reports from key economic indicators, the ISM Manufacturing PMI and ISM Services PMI, the Non-Farm payroll result comes next for the week’s final share of volatility. The next market movements are expected to align with the following week’s CPI results and anticipations.
--- Written by Razan Hilal, CMT
Latest market news
Today 09:44 AM
Today 09:34 AM
Yesterday 07:55 PM
Yesterday 05:30 PM
Latest Crude Oil articles

Today 09:34 AM

December 29, 2024 08:30 PM

December 24, 2024 04:00 PM

December 15, 2024 01:00 PM