Popular instruments
Indices explained
What are indices used for?
Indices are used in a variety of ways by traders. They can give an instant idea of how a country’s economy is performing, can provide a useful way of assessing multiple stocks at once and provide lots of powerful trading opportunities.
Indices were created for the purpose of evaluating the performance of a stock market. If an index is rising, it means that the stocks it represents are moving up overall, generally a sign that businesses are doing well and economic health is strong. A falling index, on the other hand, is a signal that stocks are struggling, which may hint at deeper problems within an economy.
Stock indices are still used for this purpose today, but they’re also a popular asset class in their own right. It isn’t hard to see why – they enable you to take your position of the biggest stocks in an economy with a single trade, as well as offering high volatility and liquidity.
Learn more about how indices work.
What is a benchmark index?
A benchmark index is a group of stocks that is used as a measure of the market as a whole. Most of the major indices you’ve heard of are benchmarks: including the S&P 500 (US 500), Dow Jones (Wall Street) and FTSE 100 (UK 100).
Benchmark indices are useful to traders as a way to compare an individual security against the wider market. For example, say that you’ve found a US stock that has grown 20% over the past four years. You might compare that growth to the S&P 500 to see how it fares against 500 of the biggest US stocks.
If the S&P 500 has grown 40% over the past four years, then your stock has actually underperformed the wider market.
Learn more about indices.
What's the best way to trade indices?
There are multiple ways to trade indices, including via futures, options and CFDs. Each has its own benefits and drawbacks, so it’s worth doing your research to decide which works best for you.
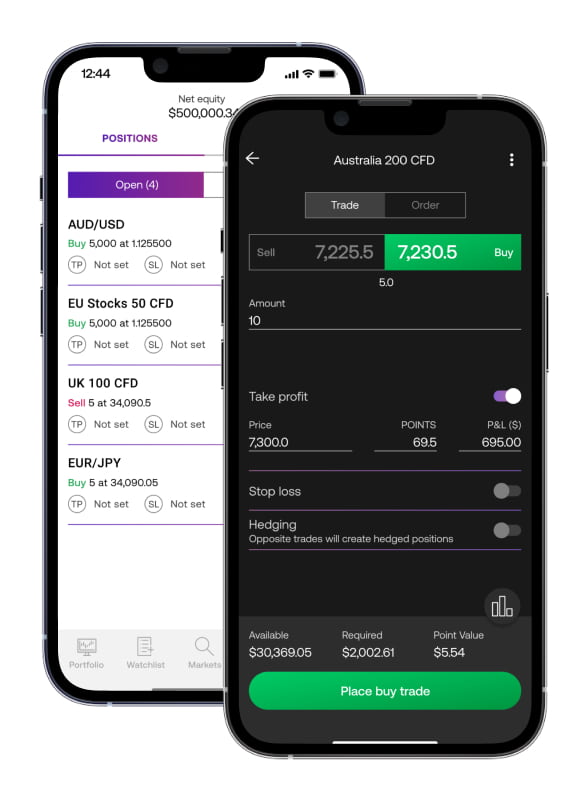
Trading index CFDs with City Index, for example, enables you to go long or short on 21 major global indices. Trading index options, on the other hand, gives you access to advanced strategies such as straddles and strangles.
You can use your City Index account to trade CFDs on indices and index options. Open your trading account now.


