- US economic data is surprising to the downside at rates not seen in over a year
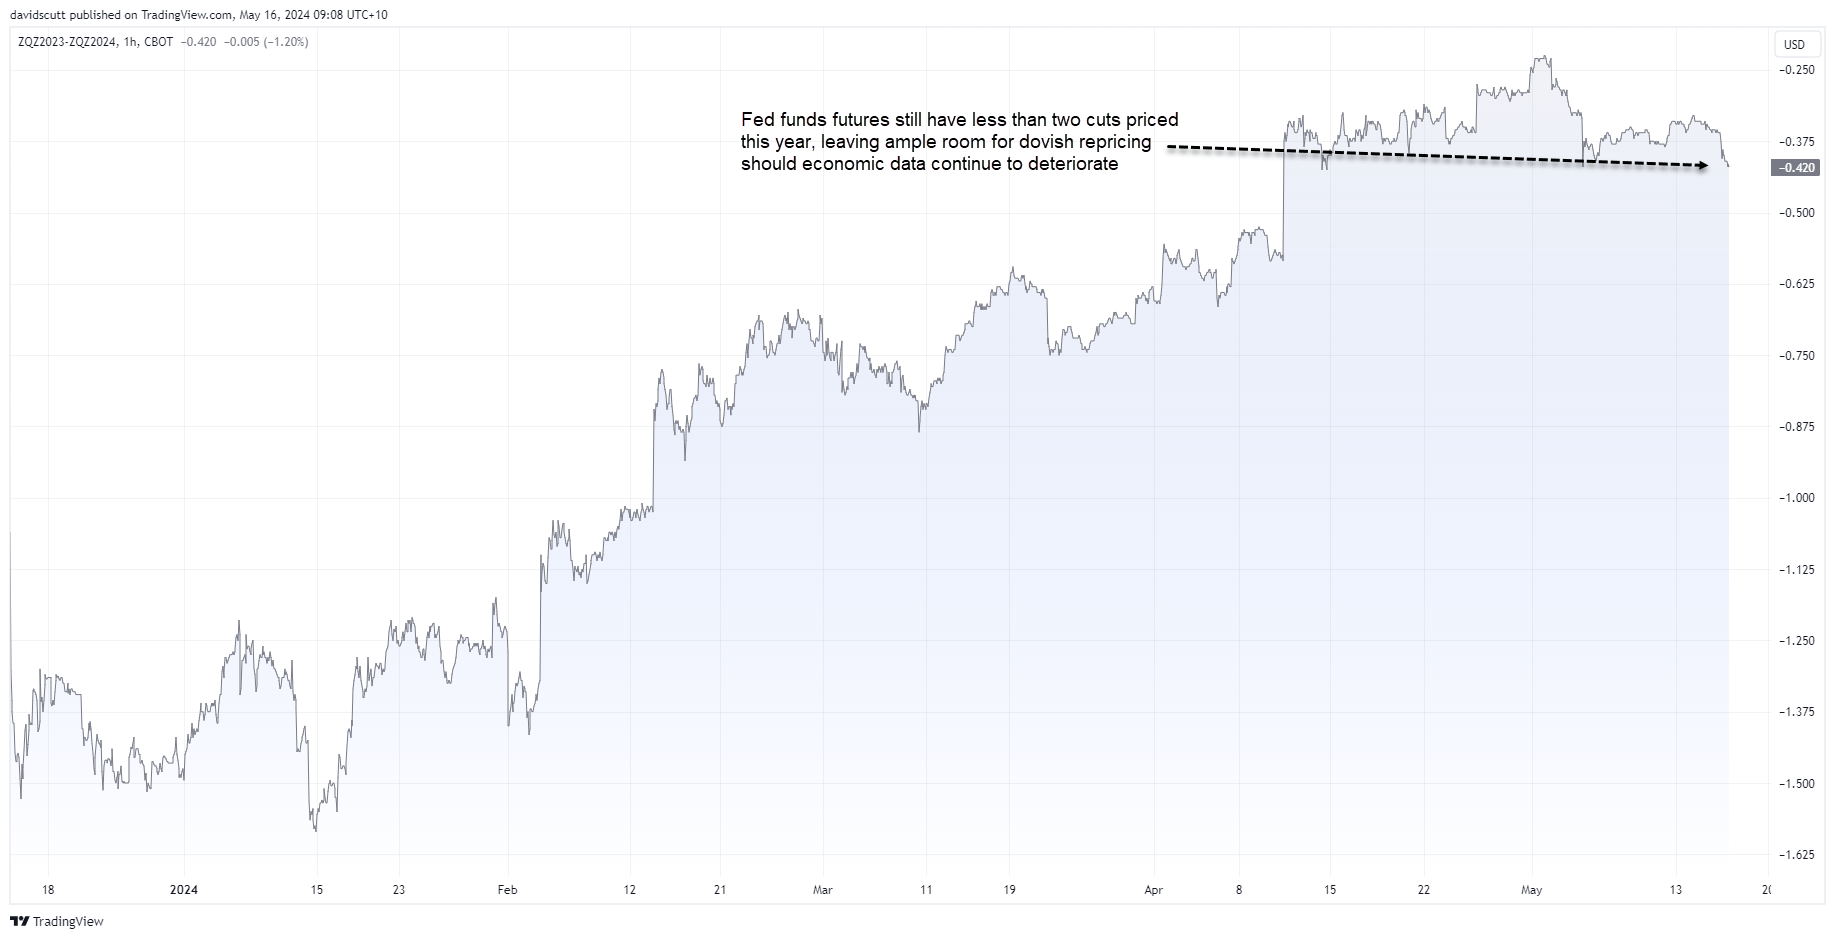
- Markets have less than two full Fed rate cuts priced in 2024, well below levels seen only a couple of months ago
- US two-year note futures have broken a key level, indicating market concerns over rates remaining higher for longer may have passed
- The US dollar index looks vulnerable to downside, closing below its 50-day moving average for the first time since March
Deciphering the US dollar signal though ample noise
Last week, I discussed the challenge of dealing with rampant noise in markets, making it difficult for even seasoned traders to decipher what signals should be listened to and what should be ignored. With so many opinions and so much information to digest, it can cloud your thinking. Even worse, it can reinforce underlying biases, making traders want to fight the tape rather than going with the flow. On that front, I’m as guilty as anyone at times. As such, sometimes, you need a noise eliminator.
When it comes to what I use to turn down the noise, I nominated US two-year Treasury note futures as the perfect instrument, combining collective fundamental and technical market views in one of the most highly liquid futures contracts globally to provide a clean signal on how I should play the US dollar.
US short-end rates suggest higher for longer fears have passed
Following a session bursting at the seams with major economic data from the United States, headlined by consumer price inflation and retail sales reports for April, my noise eliminator has generated a signal that now may be the time to ditch the strong dollar narrative markets have been running with for much of the year.

Source: Refinitiv
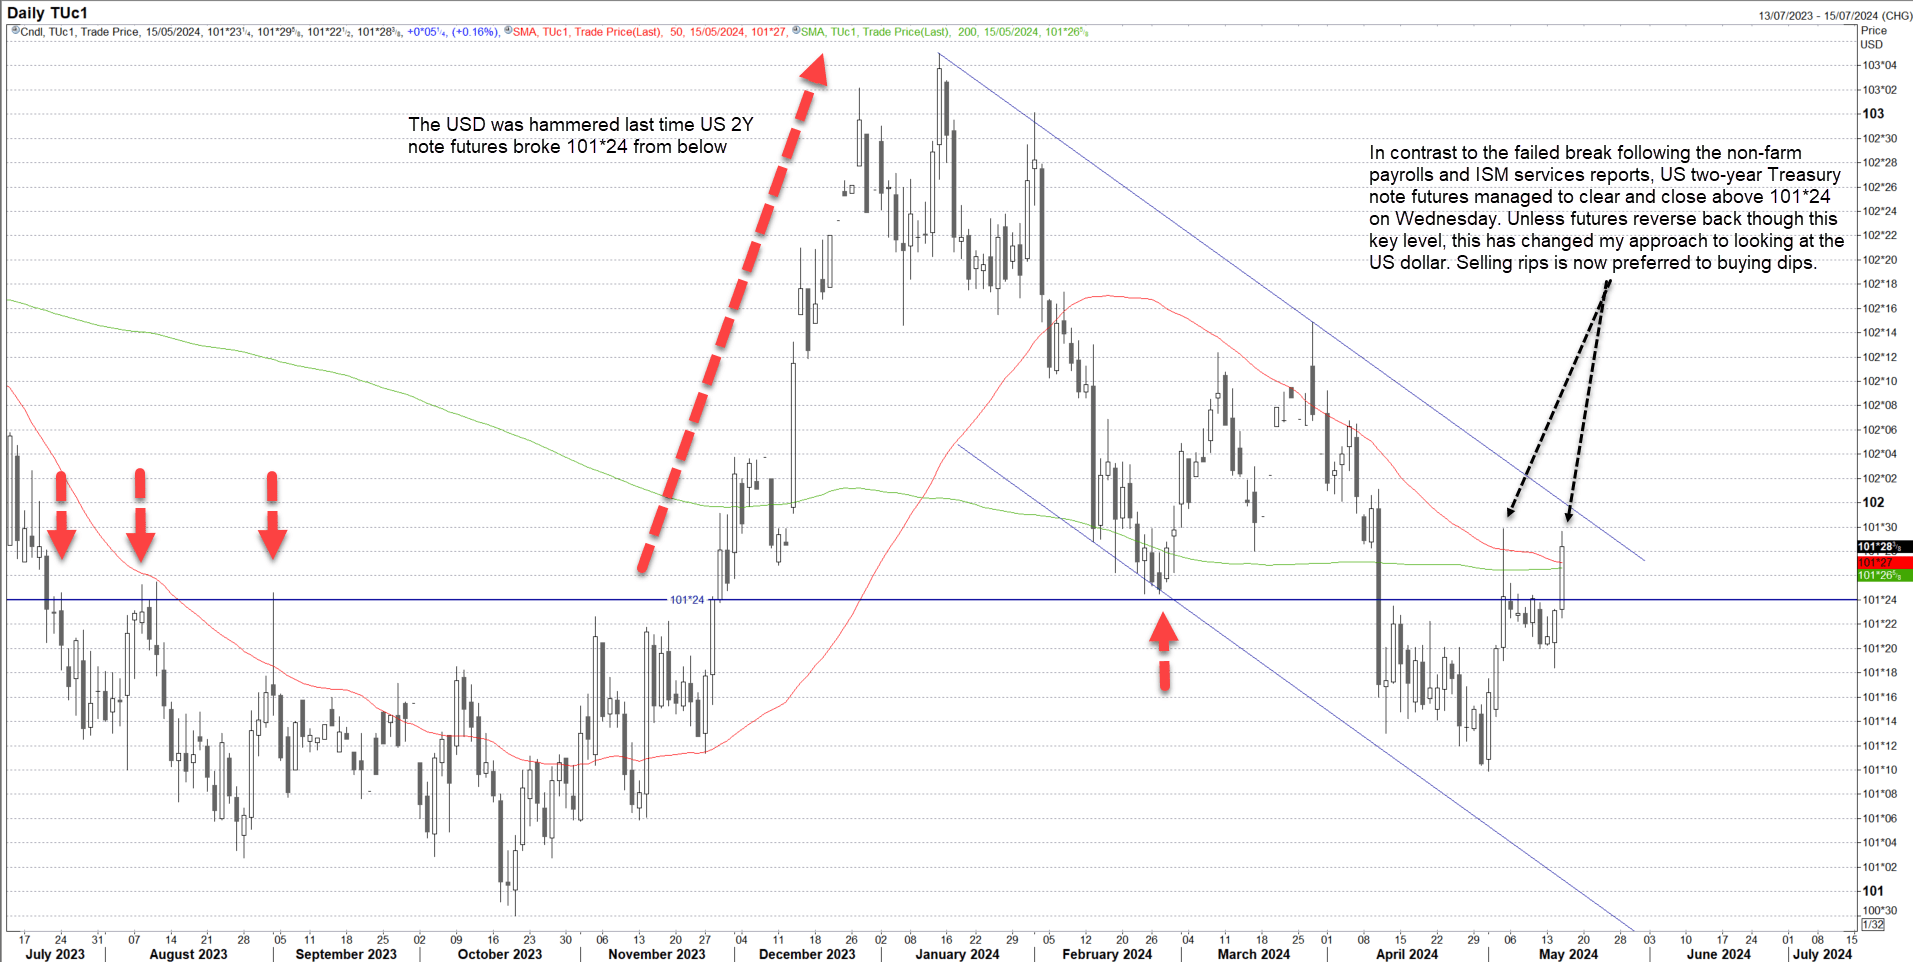
For the first time since late November, US two-year note futures successfully broke and closed above 101*24, an important technical level it has done plenty of work either side of for several years. It also managed to slice through the 50 and 200-day moving averages, closing above both for the first time since March. The price action was in stark contrast to that earlier this month when soft non-farm payrolls and ISM services reports saw futures break through through this zone only to reverse right back through it. This time, the move stuck.
If you think back to late November, it was when the risk rally in markets really kicked off, resulting in substantial US dollar weakness. By breaking through this key level again, it suggests the latest higher-for-longer rates scare may have run its course, at least based on what traders thinking collectively.
Given the important relative interest rate differentials play in FX markets, this is important. Especially when you look at how the US dollar index fared on Wednesday following the move in US two-year note futures.
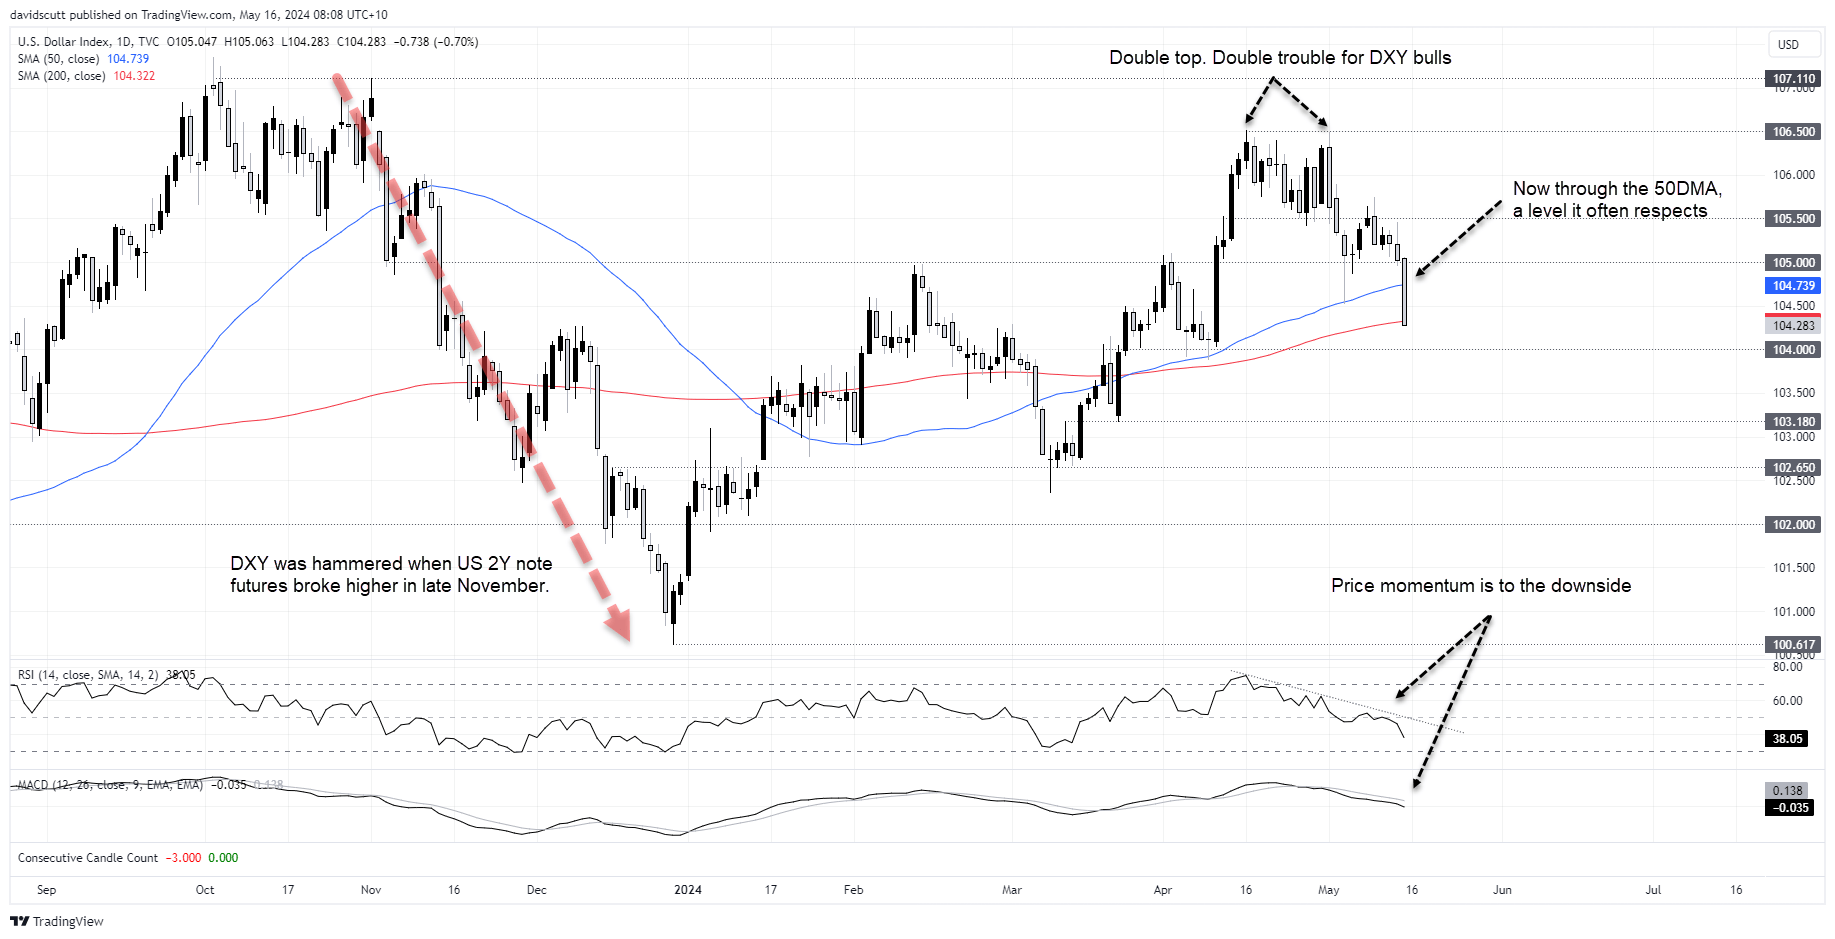
DXY hammered to multi-month lows, breaking key moving average
As my colleague Matt Simpson pointed out in his morning note, the US dollar index (DXY) suffered its largest decline of 2024, falling to the lowest level in five weeks. Not only that, the DXY sliced through its 50-day moving average like a hot knife thorough butter, closing below it for the first time in a couple of months.

The DXY was already looking unconvincing on the charts, putting in a double top before breaking the uptrend it had been sitting in since early March. With price momentum to the downside and fuel from curtailed Fed rate cut expectations at or nearing exhaustion point, the path of least resistance appears lower.
Selling dollar rips rather than buying dips, until the signal changes

Source: Refinitiv
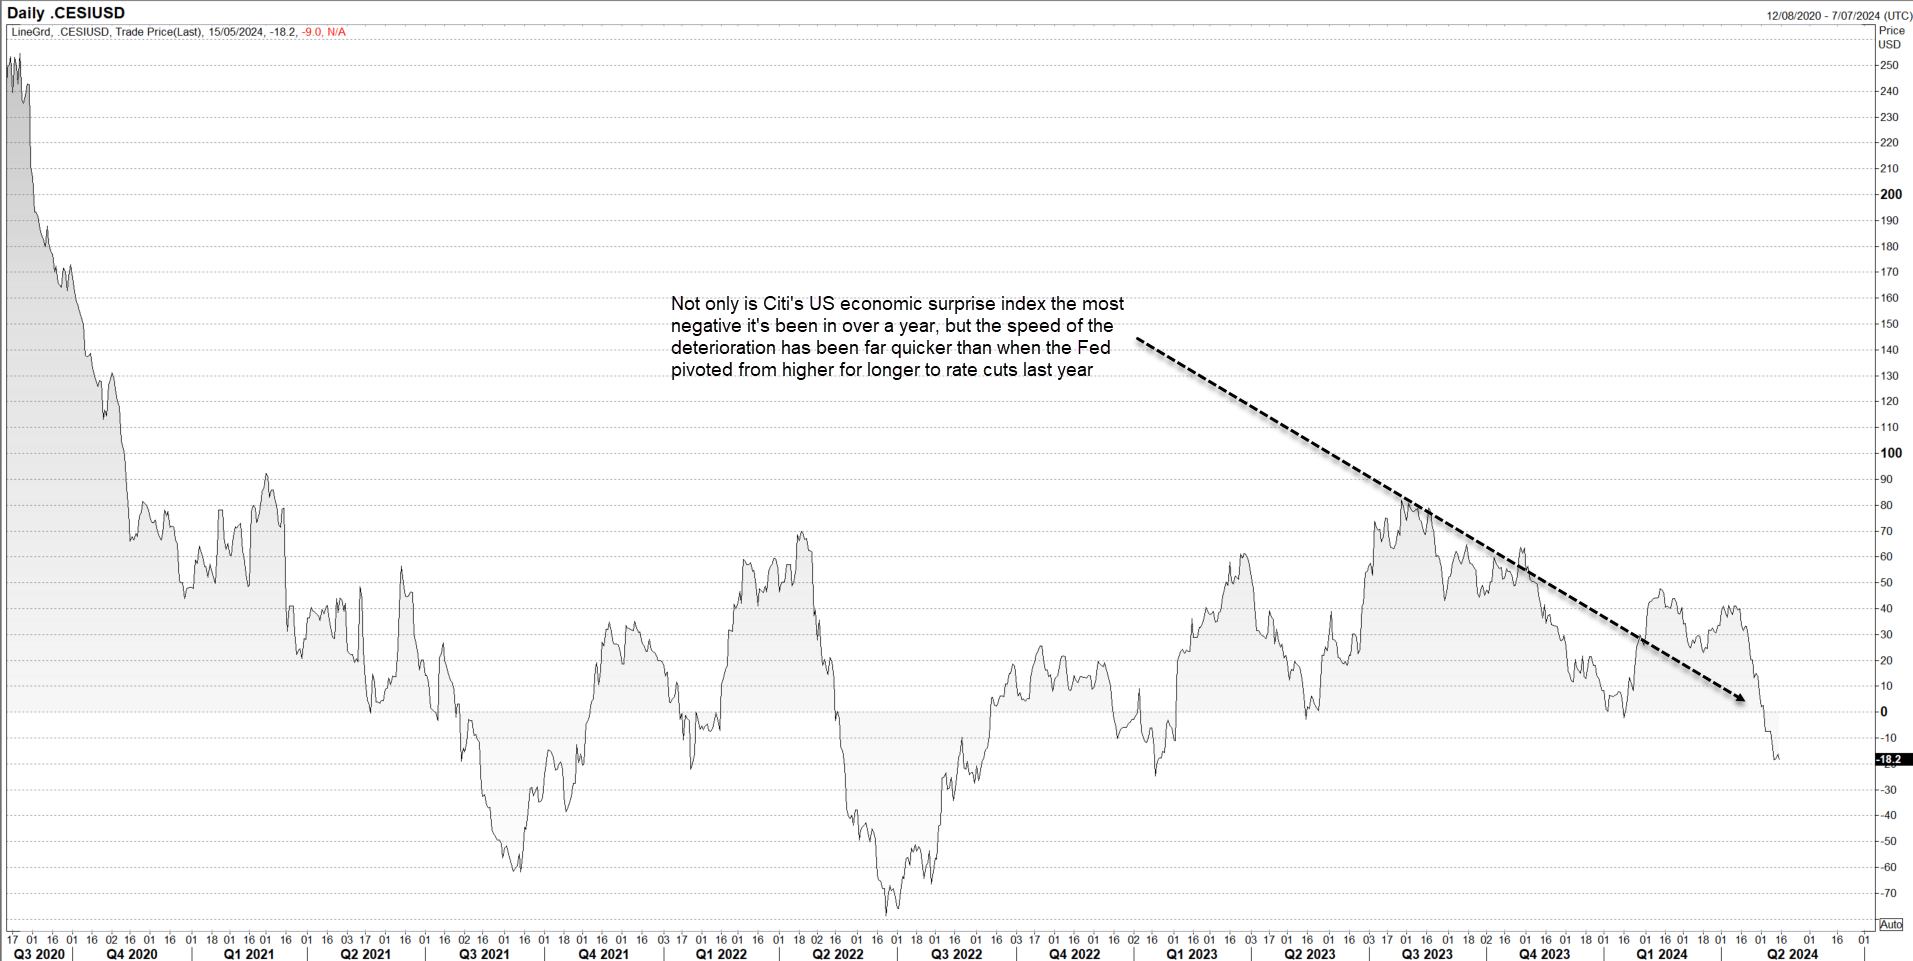
Even as US economic data surprises threaten to slide to more than two-year lows, according to Cit’s closely watched measure, markets still have less than two full rate cuts price for the Fed this year. There is still plenty of room for markets to add to rate cut bets, a scenario that could easily see the DXY mirror its performance in late 2023 when it tumbled from above 107 to below 101.

As long as US two-year Treasury not futures trade above what should now be horizontal support at 101*24, my approach will be to sell dollar rips rather than buy the dips.
-- Written by David Scutt
Follow David on Twitter @scutty
How to trade with City Index
You can trade with City Index by following these four easy steps:
-
Open an account, or log in if you’re already a customer
• Open an account in the UK
• Open an account in Australia
• Open an account in Singapore
- Search for the market you want to trade in our award-winning platform
- Choose your position and size, and your stop and limit levels
- Place the trade


