

Gold Key Points
- After-inflation interest rates remain one of the biggest factors driving the performance of gold.
- The yellow metal is drifting down to the bottom of its broad 3-month range between $2275 and $2430.
- A confirmed break below $2275 support would project a “measured move” objective for the pattern down around $2100
Sometimes, it’s not worth overcomplicating things.
While the (negative) correlation between real yields and gold has deteriorated in recent months, after-inflation interest rates remain one of the biggest factors driving the performance of the yellow metal.
With the benchmark US 10yr Treasury yield carving out a potential near-term bottom last week and rising to a two-week high today, gold accordingly topped out last week and has fallen to a two-week low. Now moving forward, the key level for bond and gold traders to watch will be the 4.31-2% level that has served as consistent support/resistance dating back to at least 2022. If yields can rally above that level, it could spur on another leg lower in gold prices.
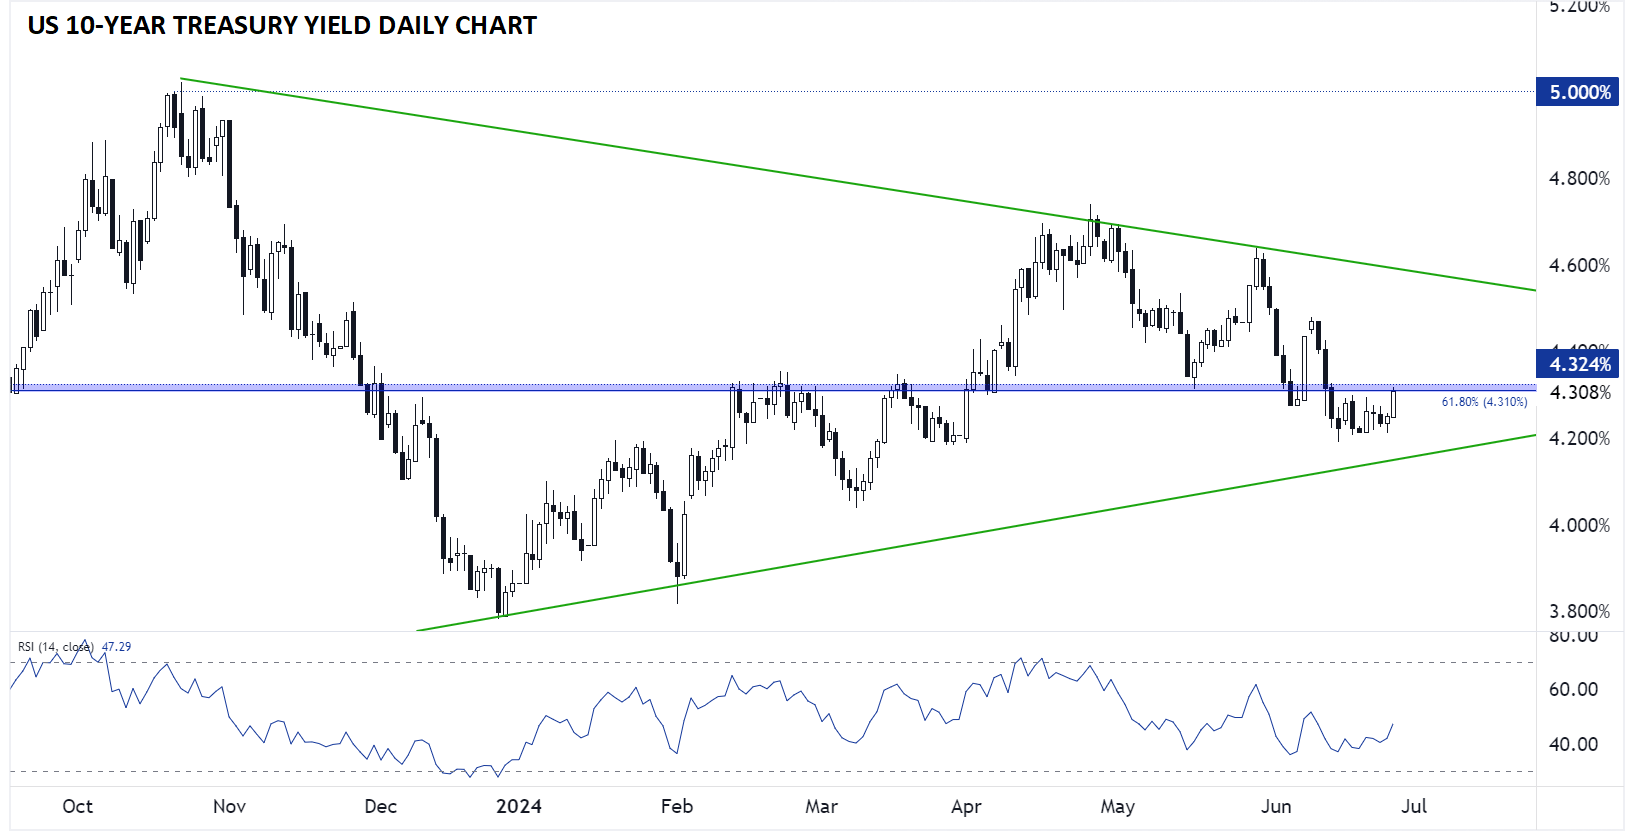
Source: StoneX, TradingView
Gold Technical Analysis: XAU/USD Daily Chart
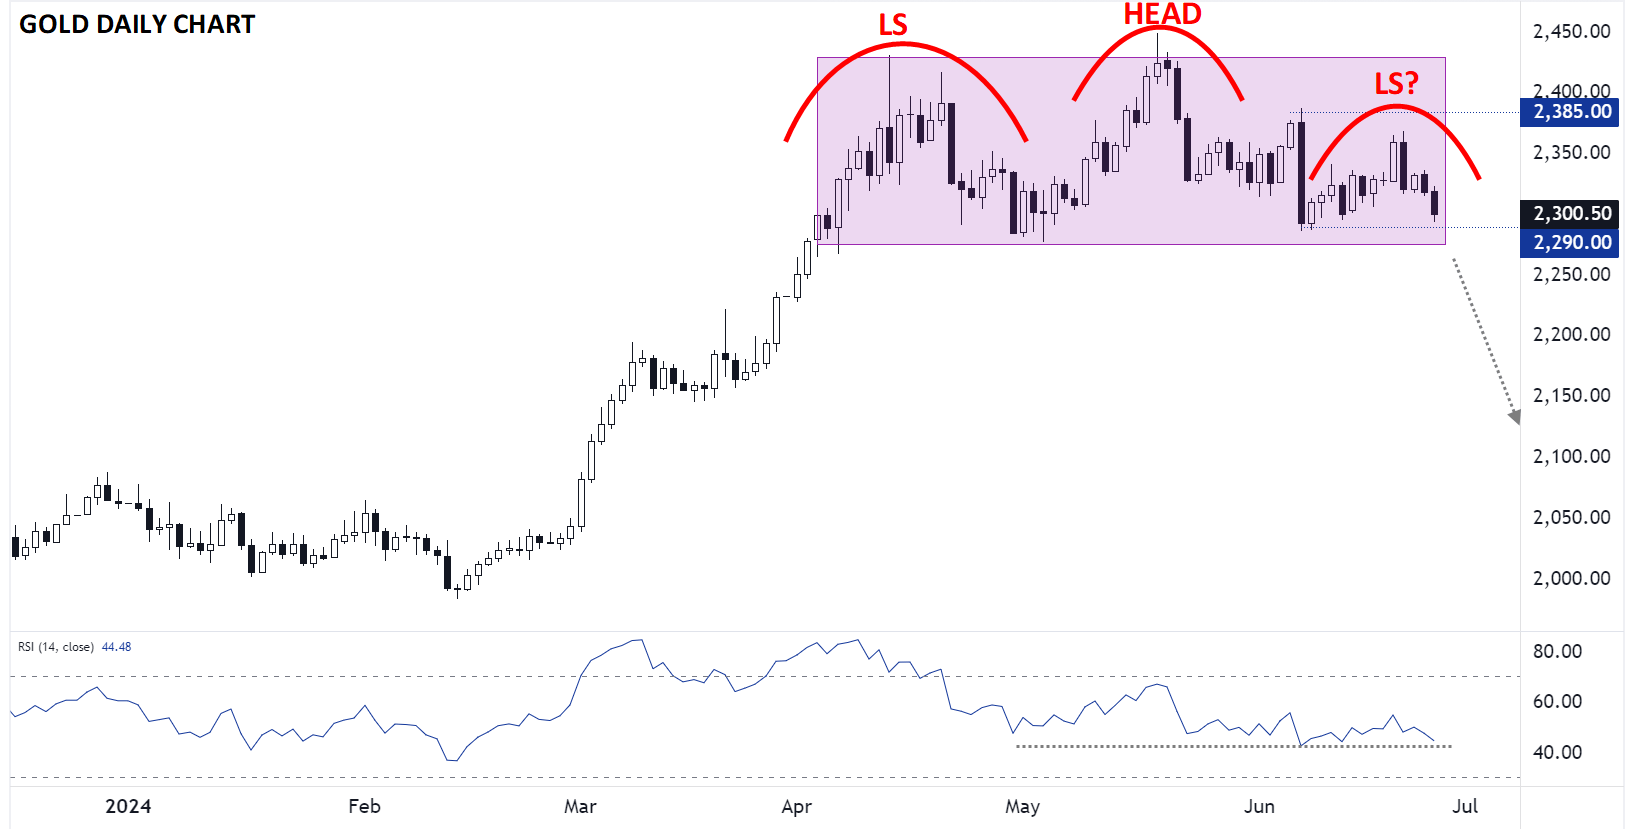
Source: StoneX, TradingView
Looking at gold specifically, the yellow metal is drifting down to the bottom of its broad 3-month range between $2275 and $2430. Many analysts have noted a potential Head-and-Shoulders top pattern at these elevated levels. For the uninitiated, this classic pattern shows a shift from an uptrend (higher highs and higher lows) to a downtrend (lower lows and lower highs) and often marks a significant top in the chart.
The pattern is typically confirmed by a break below the “neckline”; in this case, the neckline sits at the bottom of the range around $2275. A confirmed break below that support level would project a “measured move” objective for the pattern down around $2100, though as always, there is no guarantee that will necessarily play out as projected.
Regardless, bulls will want to see prices bounce from support in the upper-$2200s to keep the near-term bias from flipping to bearish heading into July.
-- Written by Matt Weller, Global Head of Research
Check out Matt’s Daily Market Update videos on YouTube and be sure to follow Matt on Twitter: @MWellerFX
Latest market news
Today 08:02 AM
Today 02:37 AM
Yesterday 10:44 PM
Latest Interest rates articles

November 21, 2024 04:47 PM

November 20, 2024 08:12 PM

November 4, 2024 04:30 PM

September 26, 2024 12:20 AM