Gold and silver have bounced back a little, although both remain lower on the week, mirroring the price action in major FX pairs. The greenback has been trending higher in recent weeks, and this has been among the reasons why buck-denominated gold and silver have been struggling. The US dollar has become investors’ preferred FX hedge against political uncertainty in Europe ahead of the first round of the French parliamentary election this coming Sunday. What’s more, traders have been largely sitting on their hands ahead of important US data releases in the next couple of weeks. These include the core PCE inflation data, due on Friday, followed by the June non-farm jobs report next Friday, and the CPI report on July 11. Despite their struggles, I continued to maintain a bullish gold and silver forecast.
Silver forecast: XAGUSD technical analysis
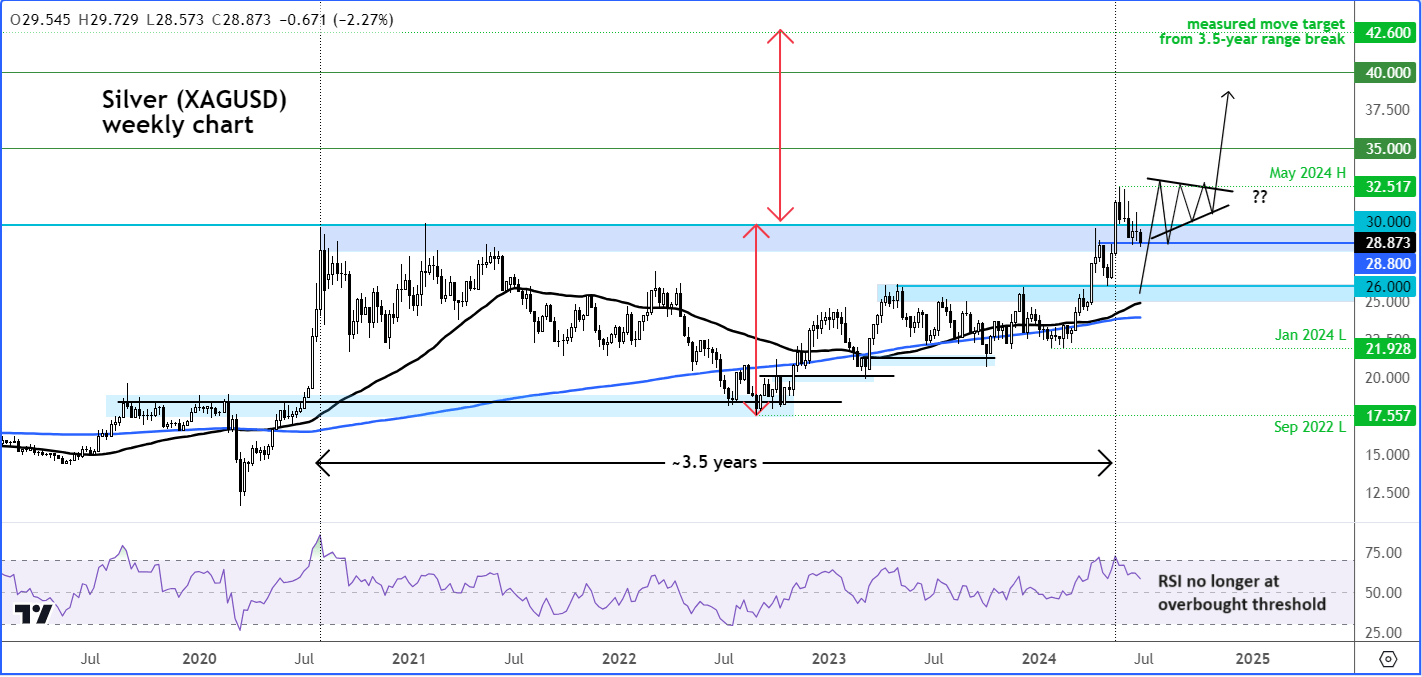
One of the reasons why I continue to remain positive on silver is to do with the big breakout we have seen on the long-term charts in recent months. While price action in recent weeks have been far from ideal, it is worth remembering that everyone operates on different time frames. So, if we start by looking at the weekly chart of silver, one can observe that in recent weeks the metal has been simply consolidating its prior big gains, around the $29 level, where it had struggled in the last several years.

This year, as we know, it finally breached that $29-$30 zone, if only for a couple of weeks, before falling back on profit-taking amid demand concerns in China. Still, XAGUSD has lots of ground to make up on bullish-looking XAUUSD chart if it wants to narrow the gold-silver ratio to near the historical average. And I think the consolidation is a healthy thing insofar as the long-term is concerned as it will allow overbought conditions to be worked off. We just need to see the formation of a bullish price candle now to potentially trigger the next phase of buying pressure. Patience is key, especially when basing your analysis on the long-term charts.
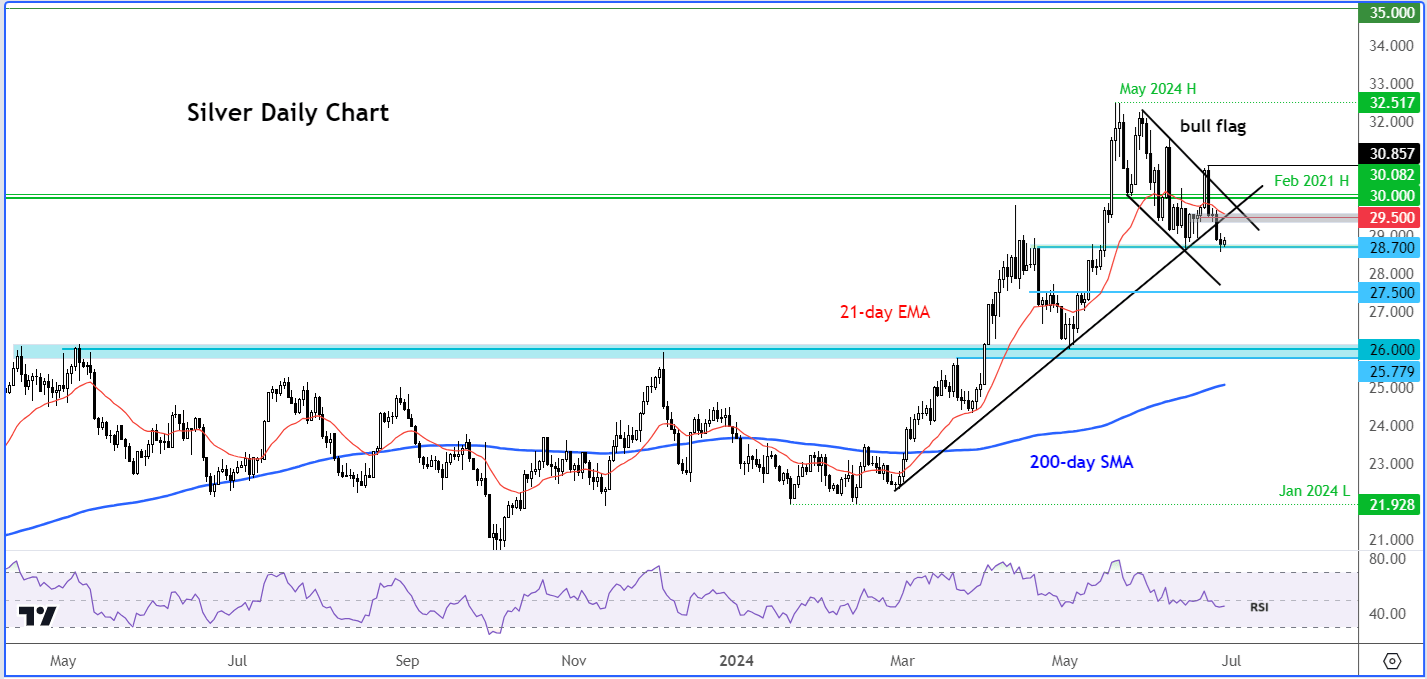
Now, if we zoom in and look at recent price action in greater detail on the daily time frame, one can see that silver is residing inside a bull flag continuation pattern. Patience is thus needed until the chart suggests it is ready to start a new bull trend again. But right around current levels are where I would like support to come in, with $28.70 having served as resistance and support in recent times.

A potential recovery of the short-term broken bullish trend around $29.50 area is what could trigger a rally. The next level that will also need to be reclaimed now is at $30, which is also where the resistance trend of the bull flag comes in. Watch price action closely.
Summary
In summary, I remain optimistic about gold and silver in the coming months, expecting new record highs above $2450 for gold, especially if the Fed implements multiple rate cuts this year due to a sharper-than-expected drop in inflation. For silver, a significant breakout earlier this year could lead to a surge to $35. However, in the short term, we need to see a bullish reversal before aiming for these longer-term targets. Thus, my gold and silver forecast remains bullish despite recent challenges.
Source for charts used in this article: TradingView.com
-- Written by Fawad Razaqzada, Market Analyst
Follow Fawad on Twitter @Trader_F_R
How to trade with City Index
You can trade with City Index by following these four easy steps:
-
Open an account, or log in if you’re already a customer
• Open an account in the UK
• Open an account in Australia
• Open an account in Singapore
- Search for the company you want to trade in our award-winning platform
- Choose your position and size, and your stop and limit levels
- Place the trade


