


USD/JPY Key Points
- Japan is replacing its top currency diplomat at the end of the month.
- Some traders view Kanda’s “lame duck” status as a sign that Japanese policymakers may not intervene until USD/JPY reaches closer to 165.
- Previous resistance at 160.00 may now provide support for USD/JPY on any non-intervention dips, providing a well-defined risk level to watch for bullish traders
One of the aspects I adore about the forex market is that exchange rates are driven by a diverse set of factors depending on the market’s dominant narrative. Everything from economic growth to employment to inflation to more nebulous factors like geopolitics, natural disasters, and even the replacement of secondary policymakers can impact currency values in the right circumstances.
That last factor is certainly contributing to the continued strength in USD/JPY at the moment.
At the end of the month, Japan’s top currency diplomat, Masato Kanda, will be replaced by Japanese Finance Ministry's international bureau chief Atsushi Mimura. As any USD/JPY trader could tell you, Kanda has repeatedly intervened directly into the forex market to buy yen and sell US dollars in an effort to support Japan’s currency, both in Q4 2022 and more recently in April/May of this year to the tune of $62B…ultimately with little effect.
Traders are speculating that Kanda, now that he’s formally a “lame duck” policymaker, may be less likely to intervene again as he runs out the string on his tenure, reducing the risk of additional intervention this month. With the spread between the benchmark US interest rate and Japan’s target rate still in excess of 5%, USD/JPY’s bullish trend could extend further from here, with some traders eyeing the 165 level as the next potential area to watch before the Ministry of Finance and Bank of Japan feel compelled to step back into the market directly.

Japanese Yen Technical Analysis: USD/JPY Daily Chart
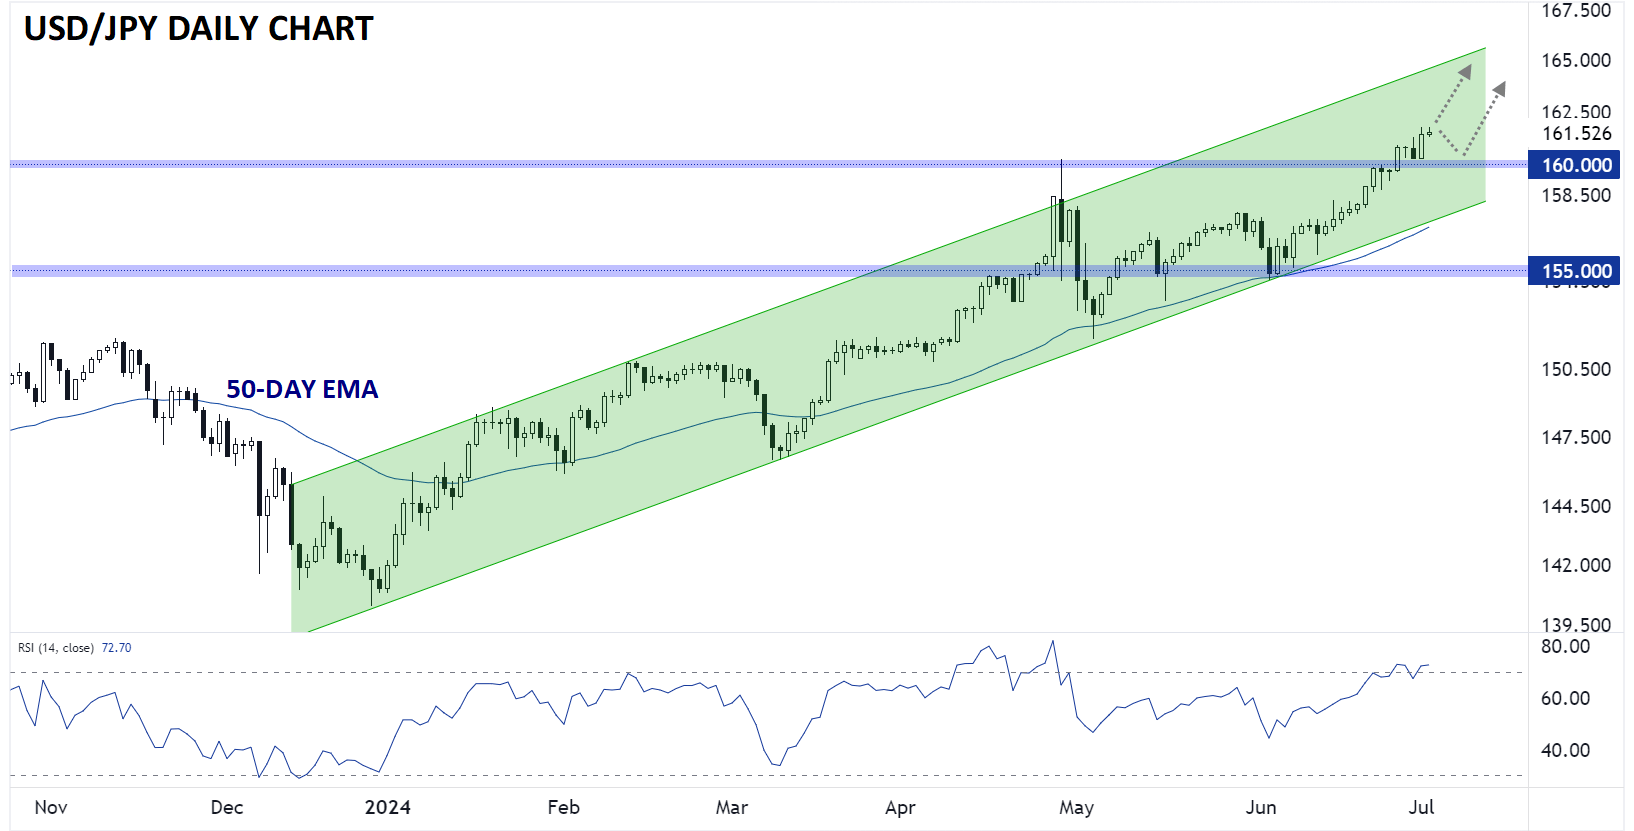
Source: StoneX, TradingView
Looking at the USD/JPY chart above, the pair has been rising within a well-defined bullish channel since mid-December, and the pair currently sits near the middle of that channel. If the pair continues its rally over the next few weeks, it may reach that aforementioned 165 area before hitting the top of channel later this month.
In the short-term, previous resistance at 160.00 may now provide support for USD/JPY on any non-intervention dips, providing a well-defined risk level to watch for bullish traders.
-- Written by Matt Weller, Global Head of Research
Check out Matt’s Daily Market Update videos on YouTube and be sure to follow Matt on Twitter: @MWellerFX
Latest market news
Today 08:30 PM
Today 07:15 PM
Today 04:10 PM
Latest USD/JPY articles
Today 08:30 PM


Yesterday 02:00 PM

December 30, 2024 03:30 PM