- OPEC will announce whether existing production cuts will be continued in early June
- Leaks ahead of the meeting may provide clues as to what decision will be made
- Russian and Saudi officials are the dealmakers to watch
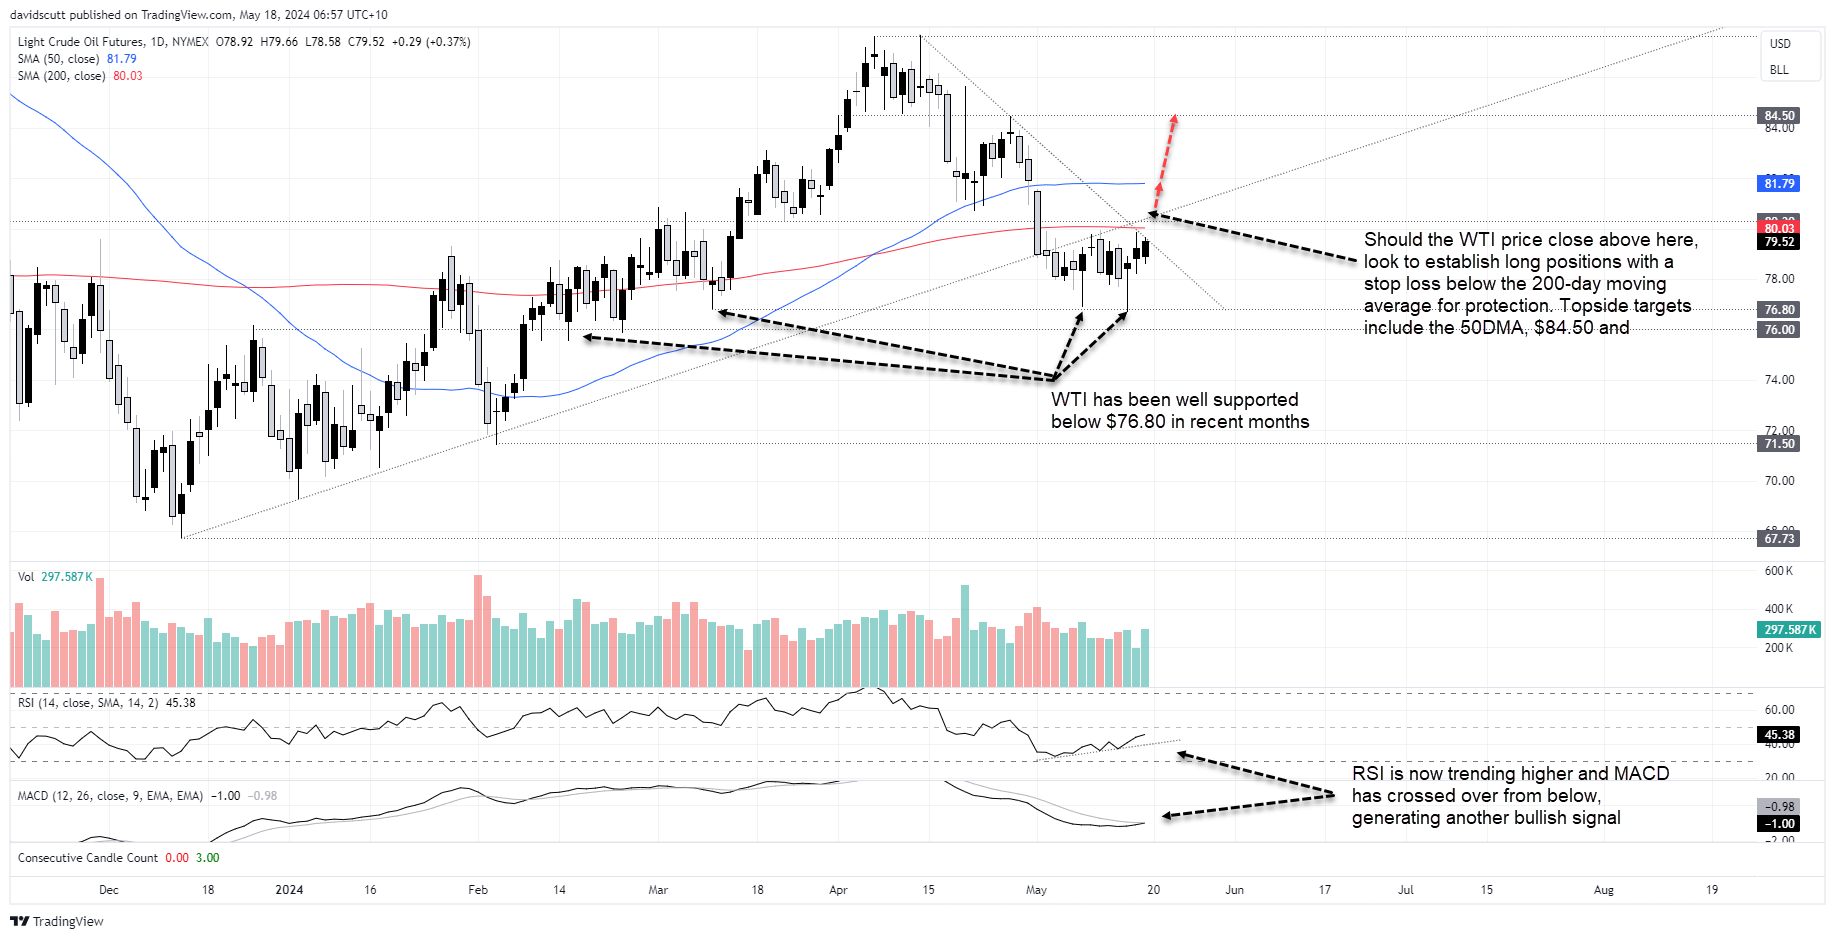
- WTI remains rangebound between the 200DMA and $76.80
- If the range were to break next week, topside is favoured over downside
Looking for OPEC leaks ahead of key meeting
Jockeying between OPEC member states and Russia before a crucial meeting on June 1 where they will vote on whether to extend temporary production cuts looms as key driver for crude oil prices this week. Until markets have greater clarity on the outcome, WTI may struggle to break of out of the sideways range it’s been trading in since the start of May, unless we see an unexpected demand or supply shock.
Ahead of the meeting, OPEC remains upbeat on the outlook for crude demand, predicting it will lift by 2.25 million barrels per day (bpd) in 2024 with another 1.85 million bpd increase expected in 2025, in line with guidance offered a month earlier.
"Despite certain downside risks, the continued momentum observed since the start of the year could create additional upside potential for global economic growth in 2024 and beyond," OPEC said in report released last week. At face value, the assessment implies there may be grounds for OPEC and Russia to pare production cuts or stop them all together.
However, having seen prices ease over the past six weeks, in part due to a perceived lessening in geopolitical risks in the Middle East despite no ceasefire being agreed by Hamas or Israel, it’s debatable whether OPEC will go down this path. If it were to boost output, it could result in sizeable price declines, especially given concerns about the US economic outlook.
Saudi, Russian officials in focus
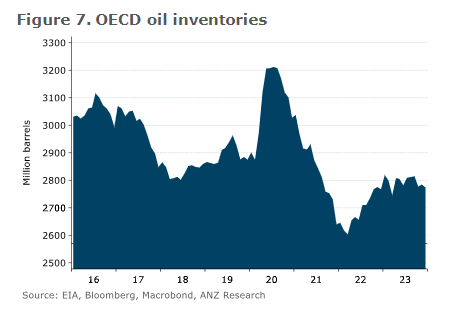
Since late 2022, OPEC and Russia have delivered a series of output cuts since to bring the crude market back into better balance, resulting in declining inventories and higher prices. The latest cut of 2.2 million bpd is due to expire at the end of June. Within that figure, the vast bulk is accounted for by Saudi Arabia and Russia at 1.5 million bpd, making representatives from those nations the key ones to watch for traders.

Source: ANZ
Geopolitics, China sentiment may be influential
Outside of jockeying ahead of the June 1 meeting in Vienna, geopolitical tensions in the Middle East have yet to be resolved, ensuring headline risk will likely remain an ever-present threat Elsewhere, US inventory data from API and EIA released on Tuesday and Wednesday respectively carry the potential to generate short-term volatility in crude prices. Sentiment in broader commodity markets may also be influential based on the price action seen on Friday.
WTI price outlook: bullish momentum hints at possible topside break
You can see the narrow range WTI has been trading in since the end of April on the daily chart, sandwiched between the 200-day simple moving average on the topside and support from $76.80 on the downside. Unsurprisingly, the price action has seen volumes ebb in recent weeks as traders await a definitive breakout one way or another.

With RSI trending higher and MACD crossing over from below to end the week, momentum indicators are turning bullish. And when you look at the strong bounces from $76.80 when the crude tested the bottom of the range earlier this month, you get the sense that if the price were to break out of the range, it would more likely be to the upside than downside.
Monday could set the tone given the bullish price action seen across the commodities complex on Friday as China announced a rescue package for its troubled property sector. If the momentum can be maintained, there’s every chance WTI may break downtrend resistance dating back to the highs set in April, putting it on track for a retest of the 200DMA.
A break and close above the 200DMA and horizontal resistance at $80.30 may encourage bulls to seek out the 50DMA located at $81.79. From there, $84.50 and $87.65 are the next topside targets. On the downside, support layered between $76.80 to $76 may be difficult for bears to crack near-term.
-- Written by David Scutt
Follow David on Twitter @scutty
How to trade with City Index
You can trade with City Index by following these four easy steps:
-
Open an account, or log in if you’re already a customer
• Open an account in the UK
• Open an account in Australia
• Open an account in Singapore
- Search for the market you want to trade in our award-winning platform
- Choose your position and size, and your stop and limit levels
- Place the trade


