


- Caixin China General Services PMI hits 10-month high
- New orders and new export orders rise strongly, inflation starting to stir
- China’s A50 may have bottomed, copper and crude oil attempting to follow suit
China’s services sector starting to fire
The Caixin China General Services purchasing managers’ index (PMI) jumped from 52.5 to 54.0, signaling activity across the largest part of the Chinese economy improved at a faster pace in May. It was the strongest result since July 2023.

Source: S&P Global
PMIs measure changes in activity, tracking business indicators such as orders, exports, staffing levels, production, inventories and prices paid. A reading above 50 signals activity grew from a month earlier. The further away from this level, the faster the improvement occurred.
New work, inflation lift
Like the headline figure, details under the hood were impressive; new work and new export orders increasing at the fastest pace since May 2023. S&P Global said anecdotal evidence pointed to improvements in domestic and external market conditions, alongside the launch of new products. With new work ramping up, staffing levels increased for the first time in four months, lifting at the fastest pace since September.
There was also evidence to suggest stronger demand and higher commodity prices is increasing inflationary pressures with input prices lifting at the fastest pace since June 2023 while final prices to customers grew at rates not seen since January 2022.
While offering a conflicting view to the weakness conveyed in the government’s more comprehensive PMI surveys, the report did not go unnoticed across Asian markets on Wednesday with risk appetite firming noticeably across several cyclical asset prices.

China A50 futures may have bottomed
China A50 futures have broken the downtrend from the 2024 highs, bolstering confidence that we may have seen a near-term bottom. The reversal through the influential 50-day moving average on Monday looms as important given how respectful the price has been of the level previously. Coupled with the downtrend break and improved sentiment towards the Chinese economy, near-term risks for the A50 look to be skewing to the upside.
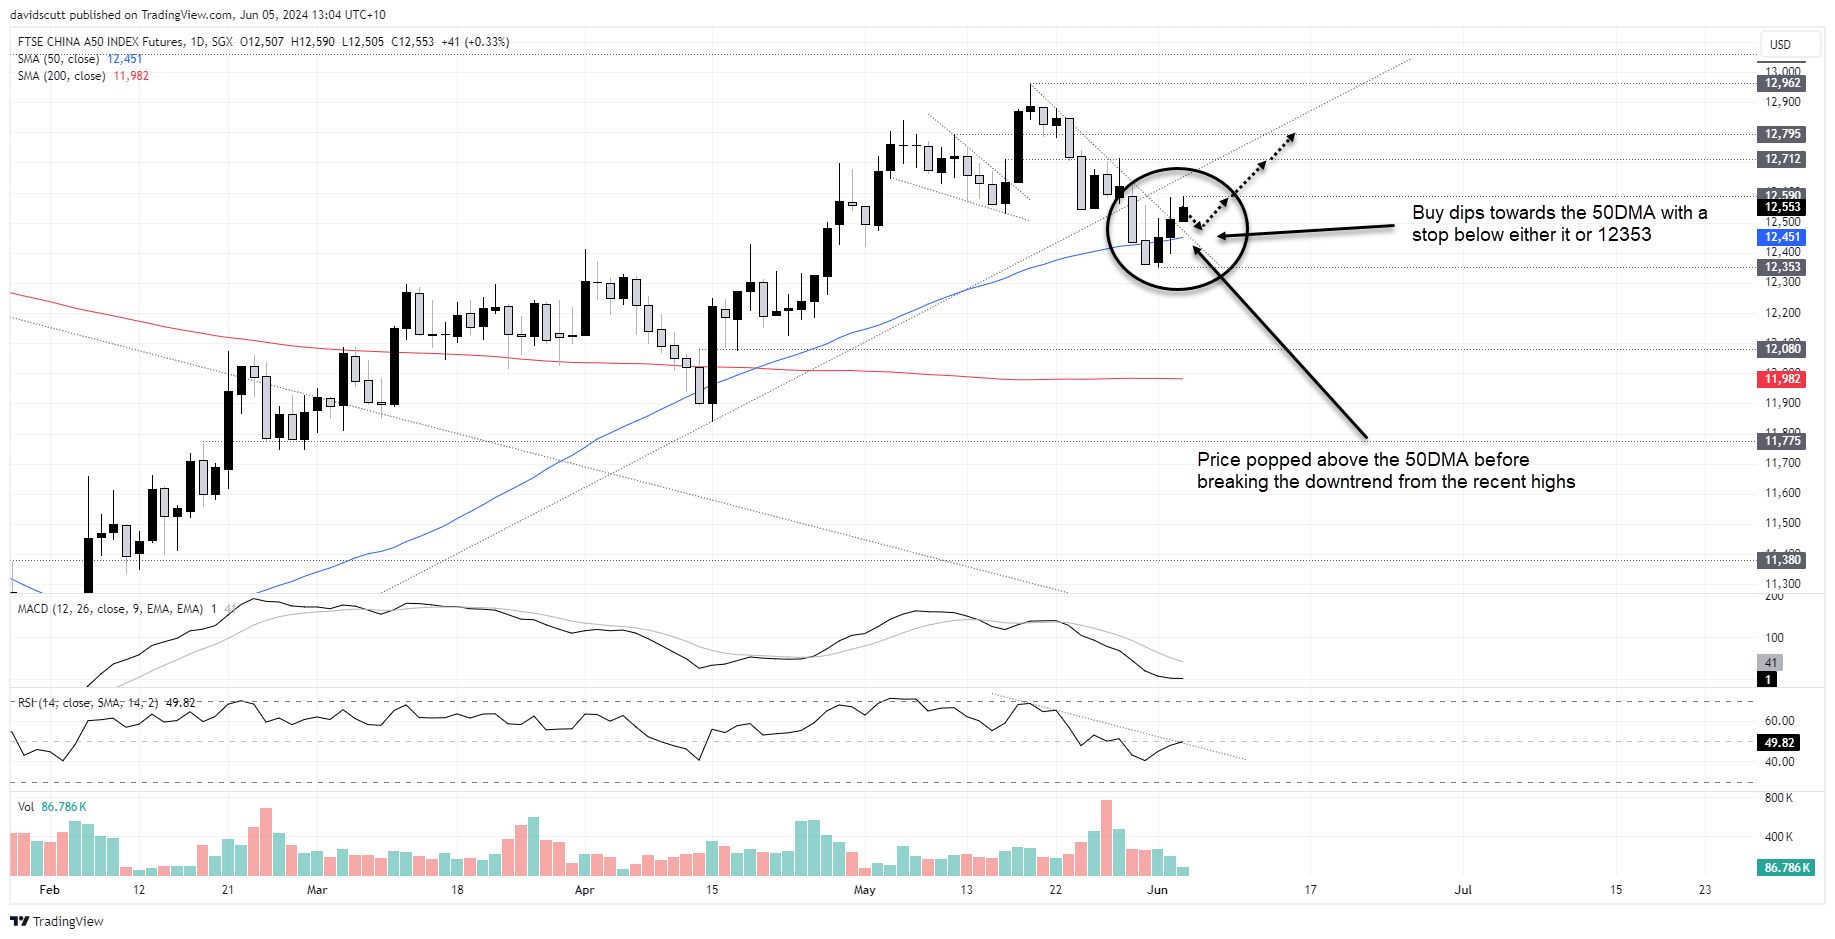
For those keen to get long, buying dips towards the 50DMA is preferable to buying at current levels, providing an improved risk-reward for the trade. With volumes easing despite signs of a market bottom, there’s every chance we may see another pullback.
Potential upside targets include 12590, 12712, 12795 or even May’s peak of 12962. A stop below the 50DMA or 12353 would offer protection against reversal, depending on the trade target you select.
In contrast to the price action in Chinese equities, the moves in commodity markets have been more muted, although the rout in the likes of copper and crude oil has stalled for now.
COMEX copper rout stalls
COMEX copper finds itself at an interesting level on the charts, sitting just above the 50-day moving average with the intersection of horizontal support at $4.50 and uptrend dating back to early February just below. While the downtrend in RSI has been broken, it’s far too early to be confident we’ve seen a bottom. But if the price remains around these levels without testing this zone, or it tests it without being able to break lower, there may be grounds for initiating longs targeting $4.746 or $4.907. A stop below $4.50 would offer protection.
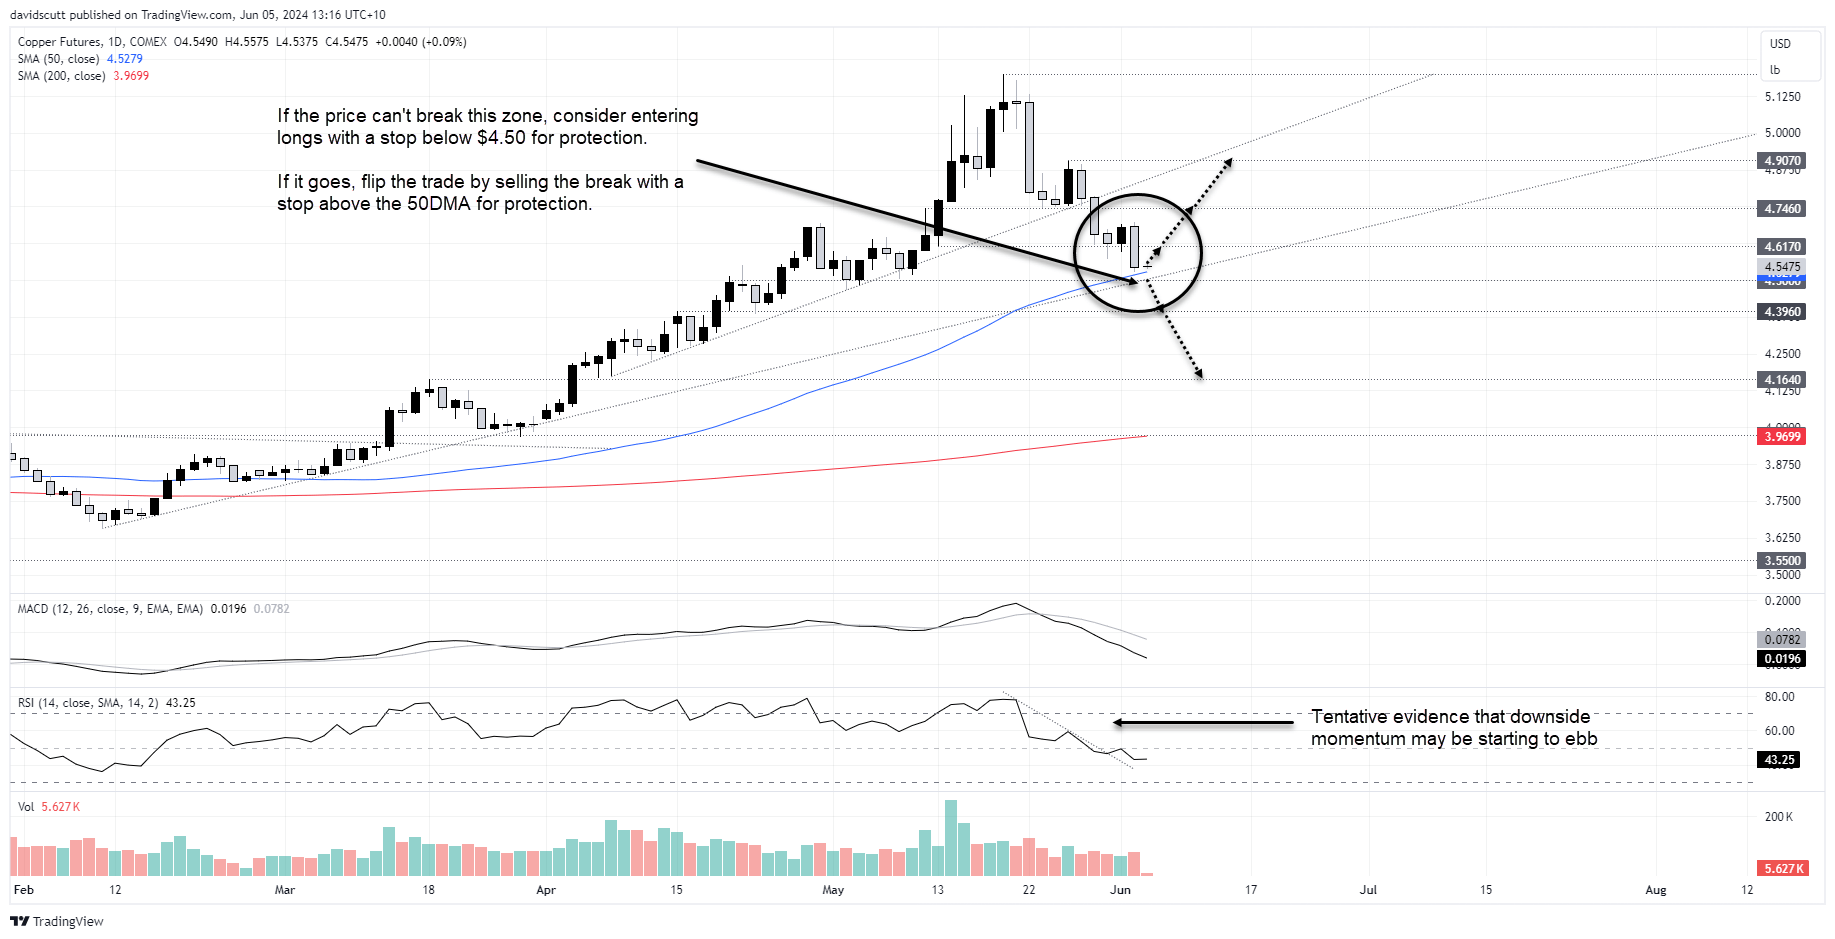
Should the price break the 50DSMA and support at $4.50, you could consider swinging the trade around, shorting with a stop above the 50DMA for protection. Aside from $4.396 there’s not a lot of visible support other than $4.25 before you get to $4.164.
Crude oil: still waiting for a price signal
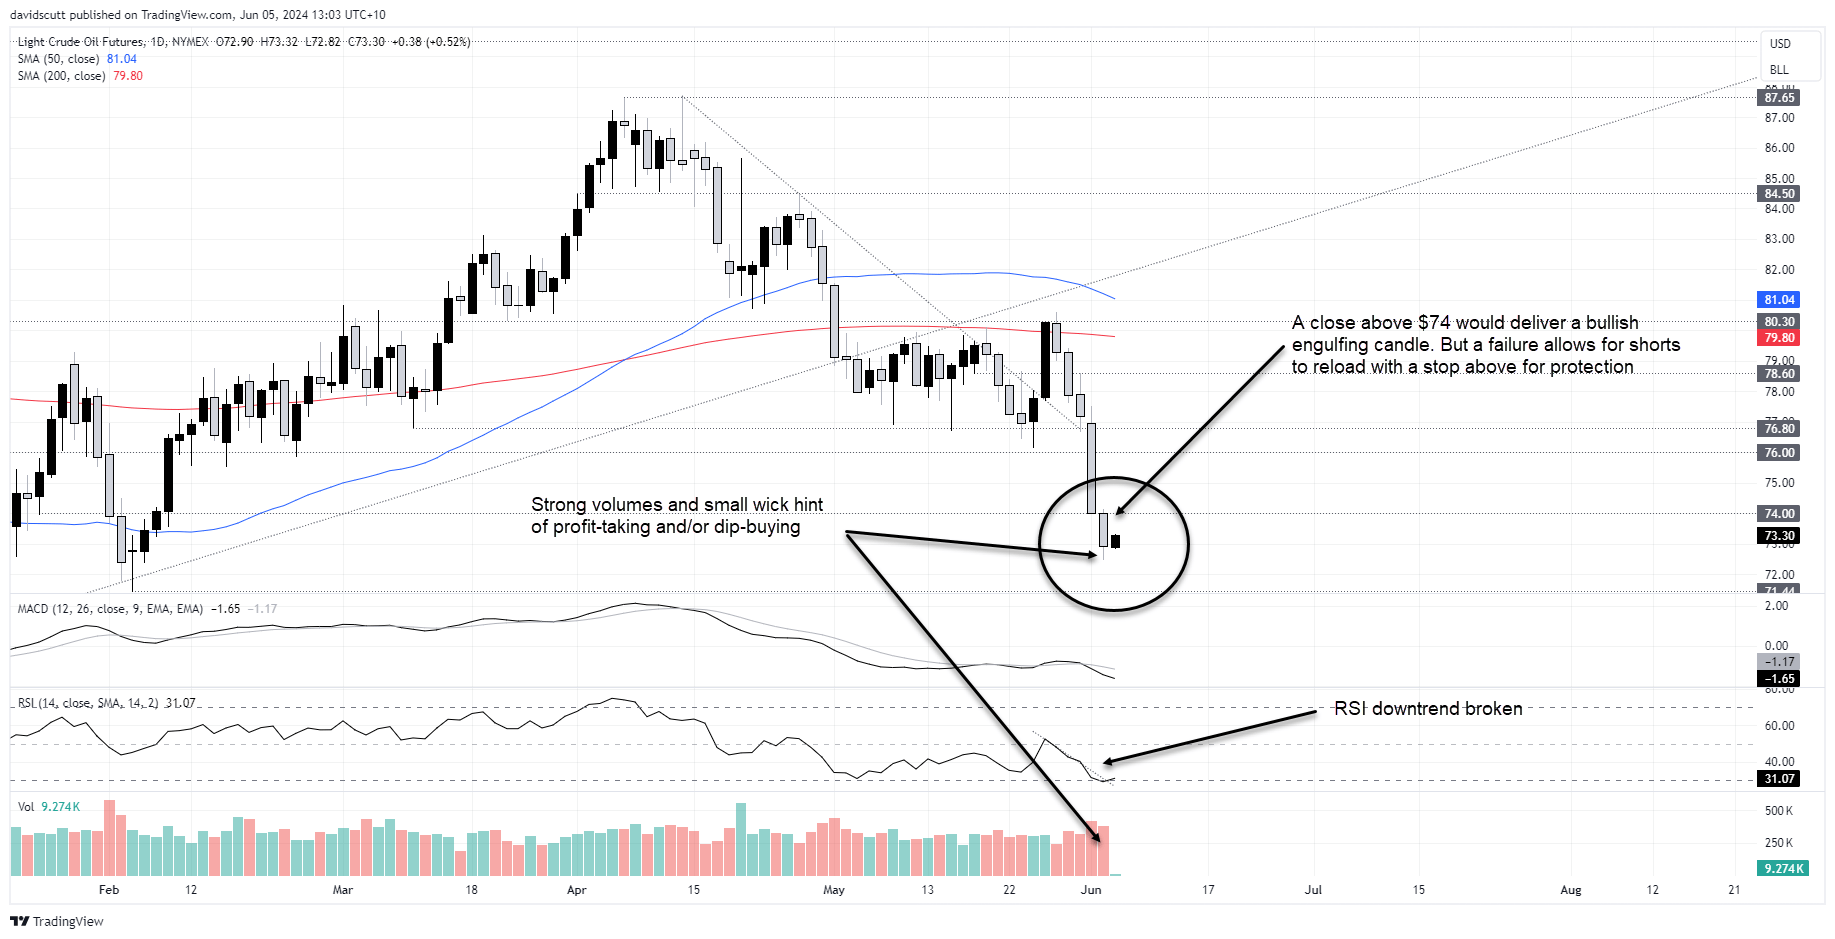
After five consecutive down days, WTI crude oil is attempting to find a bottom, inching higher in Asia on the back of light volumes. While hardly bullish, the small wick on Tuesday’s candle, accompanied by strong volumes, suggests we may be seeing profit-taking or dip buyers starting to move in. The downtrend in RSI has also broken after briefly falling into oversold territory.
But neither a long nor short looks compelling even with improved sentiment towards China. $74 looms as a level to watch in the near-term. If we see a bounce towards that level it may provide clues on what to do, providing a short entry if it fails to break or allowing for longs to be established on a break, especially if it closes above delivering a bullish engulfing candle.
-- Written by David Scutt
Follow David on Twitter @scutty
How to trade with City Index
You can trade with City Index by following these four easy steps:
-
Open an account, or log in if you’re already a customer
• Open an account in the UK
• Open an account in Australia
• Open an account in Singapore
- Search for the market you want to trade in our award-winning platform
- Choose your position and size, and your stop and limit levels
- Place the trade
Latest market news
Yesterday 07:26 PM
Yesterday 05:35 PM
Yesterday 04:15 PM
Latest Copper articles

February 4, 2025 05:24 AM

January 17, 2025 03:12 AM

December 9, 2024 10:19 PM

November 21, 2024 02:08 AM