


H2 2024 USD/JPY Outlook: Downside delayed but still forecast
- 2024 USD/JPY upside driven by a significant repricing of the US interest rate outlook
- Higher for longer outlook creates asymmetric downside risks for US rates
- Fed rate expectations were influential on USD/JPY movements in Q2
- Japanese macroeconomic factors remain a secondary consideration for traders
- H2 base case is for USD/JPY to ease back towards key support at 151.95
- Tail risks skewed towards significant downside under US hard landing scenario
USD/JPY outlook synopsis
USD/JPY upside has been fuelled by the significant repricing of the US interest rate outlook over the past six months. Traders have bought in to the higher for longer narrative, limiting room for rates to move higher without a reacceleration in inflationary pressures. But if the trajectory for inflation or activity were to turn lower, there is ample room for rate cut bets to swell. Interest rate risks are therefore asymmetric.
Should the strong relationship between Fed rate expectations extend beyond the June quarter, risks for US interest rates and USD/JPY are skewed to the downside. Just how much downside occurs will likely be determined by whether the Fed can engineer a soft economic landing.
Fed rates expectations in the driving seat
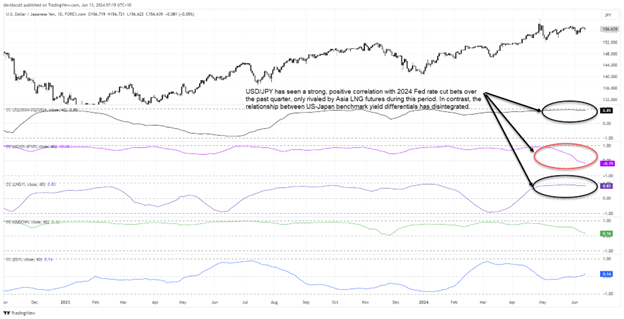
Having moved in near uniformity with yield differentials between the United States and Japan earlier this year, there was a changing of the guard for USD/JPY in the June quarter with Fed rate expectations becoming far more influential on its overall movements.
This chart tracks the rolling daily correlation between USD/JPY with several financial market instruments over the past three months.
Source: TradingView, Stonex
At 0.89, the correlation with the 2024 Fed funds future curve was strong in the June quarter, indicating shifts in rate expectations were particularly influential. This curve can be used to track market pricing for rate cuts or hikes expected from the Fed over a specific period.
The only other instrument with a similarly strong correlation and fundamental links was LNG-Platts JKM futures at 0.83, the benchmark LNG contract for delivery into Japan and South Korea. That likely reflects the United States’ status as an energy superpower while Japan remains a major energy importer.
BOJ remains a global outlier
Continuing the pattern of recent decades, the Bank of Japan (BOJ) remains an outlier when it comes to developed market central banks, tightening monetary policy this year just as other major central banks embark or flag rate cuts. But any additional tightening the BOJ delivers is likely to be modest relative to the expected scale of easing from other central banks.
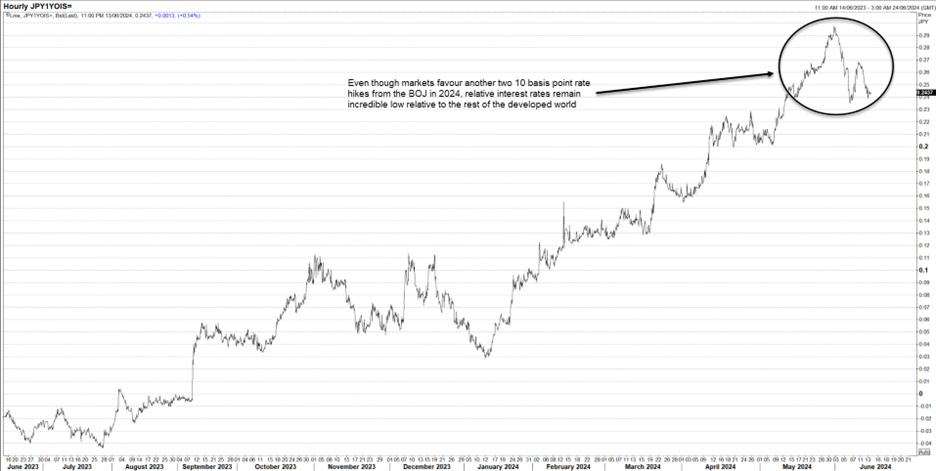
The chart below looks at the evolution of Japanese one-year overnight index swaps (OIS), or the average overnight interest rate expected by markets over the next 12 months.
Source: Refinitiv
Having lifted interest rates out of negative territory for the first time since 2016 in March, markets expect the BOJ will hike by 10 basis points at least one more time this year with a strong chance of a second move, according to swaps pricing.
But it’s a secondary consideration for USD/JPY
But even with that expected tightening, one-year Japanese yen OIS stands at just 0.2437%, a minuscule figure compared to where overnight rates sit in the United States at between 5.25-5.5%.
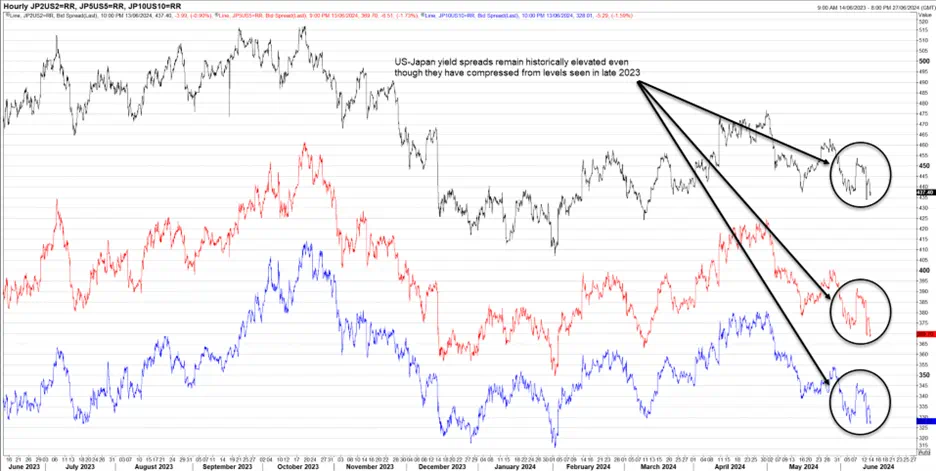
The chasm in relative borrowing is seen across the entire US and Japanese bond curves, as seen in the chart below tracking government bond yield spreads between the two nations. Two-year spreads are shown in black with five and 10-year tenors shown in red and blue respectively.
Source: Refinitiv
While yield differentials have compressed from the highs seen last year, even those for 10-year government bonds, the narrowest of all three tenors, remain elevated at over 325 basis points.
Even though yield differentials were less influential on USD/JPY movements in the June quarter, one look at the historical relationship between the two shows the disconnect rarely lasts long. Granted it’s only an assumption, but once the Fed begins to cut rates attention will shift from when the easing cycle will begin to how deep cuts will be, potentially seeing increased focus on relative returns that may curb or lead to carry trades being reversed.
Given the Fed has far more room to adjust rates than the Bank of Japan, should yield differentials return as a key driver in the second half of the year, it means incoming US economic data may play a key role in determining USD/JPY movements. In contrast, macro factors in Japan screen as a far lesser consideration on USD/JPY performance.
Risks skewing towards earlier Fed cuts
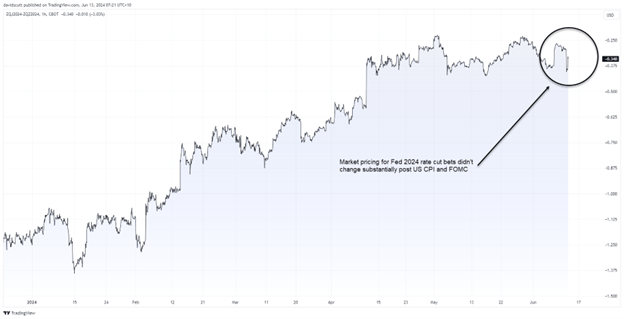
2024 has been a story of Fed rate cuts being slowly whittled away, falling from nearly seven 25-point moves in early January to just one by June. You can see that visually in the shape of the 2024 Fed funds futures curve below.
Source: TradingView, StoneX
Economic activity and sticky inflationary pressures have proved to be far more persistent than most market participants thought entering the year.
But there are signs that backdrop is starting to change.
After a prolonged period of beats, aggregate US economic data surprises, as tracked by Citi, have turned negative, indicating that data is undershooting expectations more often than not. The stretch of misses has also been the longest since 2022, even with lowered expectations following a slowdown in activity in the first quarter of the year.
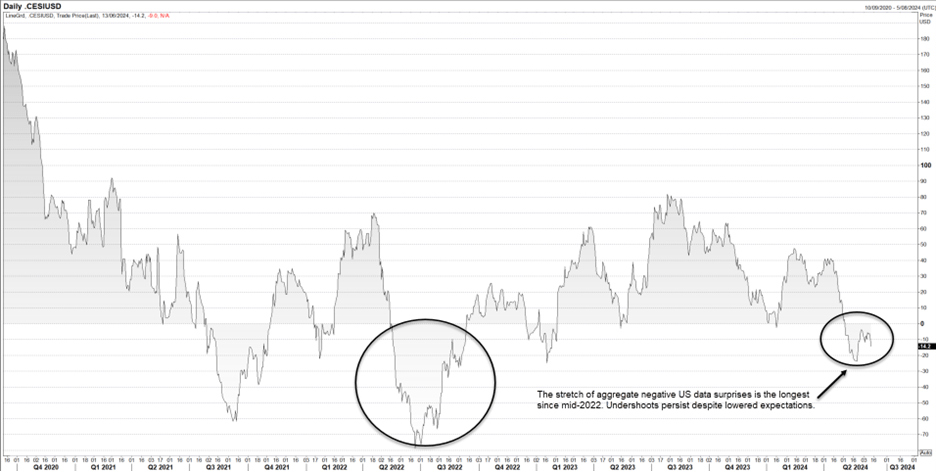
Source: TradingView, StoneX
While the Fed has made it clear it needs to see sustained progress in getting inflation back towards its 2% target before considering cutting rates, it’s notable the disinflationary trend seen in the second half of 2023 looks to have resumed in April and May, bringing it closer to easing rather than moving it further away.
Given it will take time to bolster confidence that price pressures are returning to pre-pandemic norms, it’s the Fed’s other mandate – to promote maximum employment – that could force its hand earlier.
Payrolls growth may be booming but it’s quickly becoming the exception to the broader rule. Job openings are falling while unemployment and jobless claims are pushing higher. While economic cycles have their own intricacies, one feature seen in most is that when labour market conditions begin to deteriorate, it often happens quickly. Should this episode be similar, it points to the risk of the Fed having to move as soon as September with a follow up cut either in November or December.
Such a scenario looks increasingly likely rather than being an outlier.
USD/JPY H2 outlook
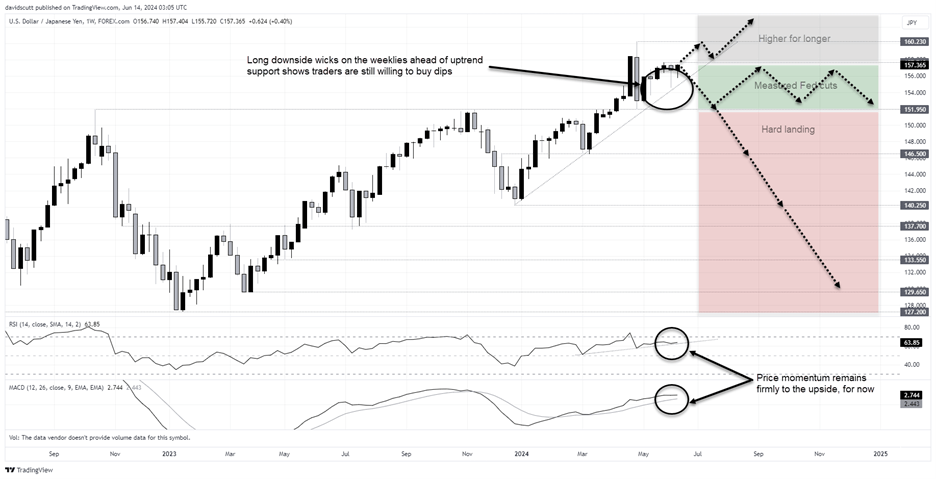
There are three plausible scenarios for USD/JPY in the second half of 2024: higher for longer, measured Fed cuts, and a hard US landing. Each is discussed below, along with the probability of each occurring and implications for USD/JPY.
When yield differentials are measured in the hundreds of basis points, and they’re the main driver of USD/JPY, it’s obvious that if there’s to be any significant shift in spreads and exchange rate it will driven by the US.
Higher for longer (10%): Fed does not cut rates in 2024 with yield differentials between the US and Japan widening towards the October 2023 highs. The BOJ is prompted by the Japanese government to intervene on occasion to counteract yen weakness. USD/JPY remains in uptrend and takes out the April highs above 160.
Measured Fed cuts (55%): Fed cuts twice in 2024 to mitigate building economic risks. USD/JPY breaks uptrend but downside is limited due to buoyancy in riskier asset classes, limiting unwinds of carry trades. USD/JPY sits in a range between 158 down to major support at 151.95.
US hard landing (35%): History suggests soft economic landings are hard to orchestrate. Fed is forced to cut rates aggressively due to an abrupt decline in economic activity and sharply higher unemployment. Asset prices weaken and market volatility lifts, leading to large-scale unwinds of carry trades. USD/JPY falls sharply on risk increased risk aversion, dropping through key support at 151.95. If accompanied by a global downturn, market movements become disorderly leading to substantial downside risks.
Source: TradingView, Stonex
