


Gold Outlook H2 2024
The first half of 2024 has gone as we had expected in our H1 forecast, with gold prices hitting repeated record highs throughout March and April, and once in May, before easing back on profit-taking. From a low of $1984 in February, gold reached a high so far of $2450 per ounce, marking a $465 or 23% rise before pulling back in the latter half of May. Heading into the second half of the year, the fundamental backdrop remains positive, pointing to a bullish gold forecast. Inflation is still going strong in the US and while it has fallen sharply in Europe and other parts of the world, the threat of deflation is slim. Investors (and central banks) that missed out on the big move will be keen to get their hands on the shiny metal on any noticeable dips in prices. We are also bullish on silver forecast for H2.
What factors will influence gold forecast in H2?
Most of the factors propelling gold to record highs in the first half of the year will remain valid in the second half as well. One of the biggest drivers behind gold was wealth protection against rising prices, after several years of above-forecast inflation eroded the purchase power of fiat currencies, in some cases significantly. While central banks mostly kept interest rates at multi-decade highs to combat inflation, gold was able to hold its own well despite higher bond yields providing attractive nominal returns on safe-haven government debt. Investors also chose the racier technology sector stocks over bonds, which paved the way for one of the biggest and impressive stock market rallies of all times.
While global inflation has eased, the disinflation process has been painfully slow. For this reason, the US Federal Reserve, at its June FOMC meeting, revised its interest rate cut projections to just one from 3 it had forecast in March. Gold’s slight negative reaction in response suggests metals traders were anticipating a faster policy normalisation. Indeed, the market was pricing in two rate cuts, following weaker-than-expected CPI (and PPI) data for the month of May that was released in June.
Rates pricing has been quite volatile due to the volatility in data. We certainly wouldn’t be surprised if economic data deteriorates in the coming months to trigger a new wave of rate-cut optimism. Such a scenario could only boost the gold forecast since the metal has a historical tendency to correlate negatively with changes in interest rate projections. Therein lies the key caveat to our bullish gold outlook for H2. If incoming inflation and wages data continues to show stickiness in price pressures, then this may delay the policy normalisation process and keep interest rates higher than previously expected. Gold’s eye-catching advance earlier this year was driven in part because of expectations that rates will be brought lower multiple times in 2024. With the Fed continuing to defy expectations, this has kept the dollar supported, especially against the Japanese yen. Despite this, the dollar's strength hasn't significantly impacted gold so far in 2024. However, a more profound and sustainable dollar rally and high bond yields could reduce gold's appeal more significantly in H2, should inflation re-accelerate.
Gold forecast H2 2024: Anticipated Rate Cuts
Some of the major central banks such as the European Central Bank and Swiss National Bank have already started to cut interest rates. Others such as the Bank of England and US Federal Reserve are expected to cut rates around the middle or end of Q3. The key question is how many more rate cuts will follow or whether inflation continues to defy expectations and prevent further policy loosening.
So, a lot depends on incoming economic data. Should we see more actual rate cuts in H2 than expected, then this s should further lift gold prices. Meanwhile, the downside should be limited in any case, owing to pent-up demand due to recent high inflation and fiat currency devaluation.
Gold (XAUUSD) forecast: technical analysis
Source: TradingView.com
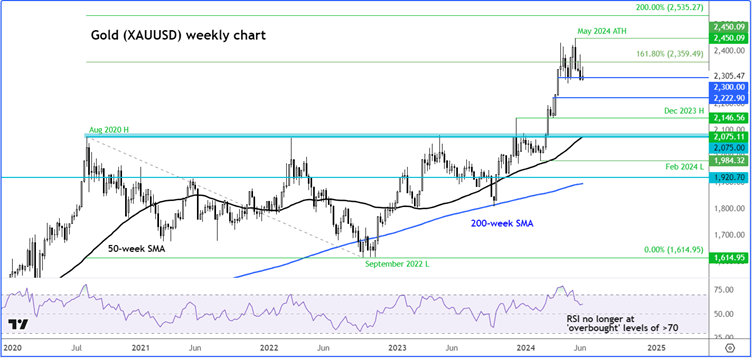
Gold’s consolidation since the start of April has allowed the Relative Strength Index (RSI) to work off its ‘overbought’ conditions mainly through time, than price action, which is always a bullish sign. But even if gold were to weaken further from here, there are numerous support levels that could provide a floor on the way down. The bears will have to exert significant pressure to turn the tide meaningfully in their favour.
Of course, it's possible that we may see a more significant correction in gold prices as we head deeper into H2. Even so, a potential correction is not going to materially change the long-term fundamentally bullish gold forecast. So, at worst, we are expecting to see only a modest sell off in gold prices. At best, watch out for further new records above May's high of $2450.
Indeed, the precious metal has formed several higher lows and higher highs in the past several months, and this sequence has to end before we put on hold our bullish view from a tactical point of view. The most recent higher low was formed in February 2024 at $1984. So, this is the level that needs to be breached to signal an end to gold’s long-term bullish trend. Any bearish price action we see in the interim should be taken with a pinch of salt, in light of this year’s significantly bullish price action.
Given that gold would be trading at uncharted territories should May’s high of $2450 breaks, the next upside targets could be based on psychologically-important levels such as $2500 or Fibonacci extension levels. One measured-move objective that gold could aim for is at $2535. This level marks the 200% extension level of the last significant downswing that took place between August 2020 to September 2022. The 261.8% Fibonacci extension of the same price swing comes in at $2819. Therefore, $2450, $2535 and $2819 are our next long-term objective targets.
Among the key levels of potential support to watch, $2222 is the first line of defence for the bulls, should gold break $2300 support decisively. Below that level, $2146, which corresponds with the December 2023 high, is also an interesting level to watch. The most significant support area on gold is the zone between $2075 to $2081. Here, gold had formed a high in 2020, 2022 and on a couple of occasions in 2023. Once strong resistance, this is now the most important support zone to keep an eye on in the event of deep pullback. What’s more, the 50-week moving average also converges here as well.
A word or two on silver
Source: TradingView.com
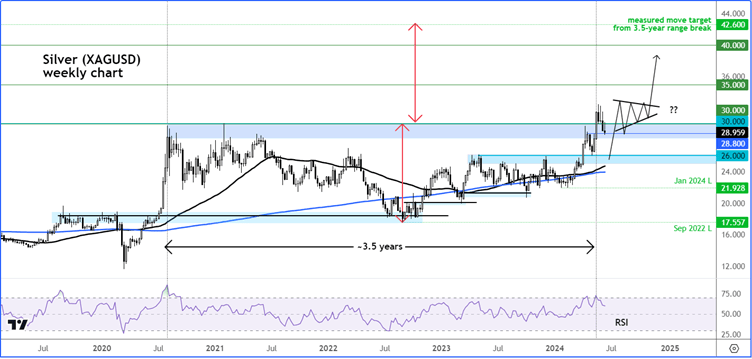
Silver also broke above a major resistance area of $29-$30 this year, although demand concerns over China meant the breakout would quickly run into trouble. Still, the white metal has lots of ground to make up on the yellow metal and the second half of the year could see it narrow the price gap to near the historical average.
A potential rise back above $30 is what could trigger the next phase of technical buying pressure now that the RSI is no longer at ‘overbought’ levels of 70 and above. A potential rise to $35 on silver should not come as surprise in the months ahead.
In a nutshell
To summarise, we maintain a bullish gold forecast for the second half of 2024 and expect to see new record highs above $2450, especially if the Fed opts for more than one rate cut this year as a result of a sharper-than-expected drop in inflation. Silver, meanwhile, could rally to $35 in light of its significant breakout earlier this year.
