

Today’s key US data releases came in below expectations, but instead of hindering the dollar or bond yields, this actually failed to have any major impact. Perhaps the bizarre reaction could be explained away by rising crude oil prices, fanning inflation worries. What’s more, French election uncertainty remained, even if we saw a bit of a relief rally in mainland European shares earlier this morning, after the National Rally recorded a smaller margin of victory in French elections than. Anyway, as bond yields and the dollar both pushed higher, gold came off its earlier highs. The metal was still in the positive territory, however. Investors are looking forward to more data releases this week, culminating in the release of the June payrolls data on Friday. Our bullish gold forecast remains unchanged.
Video: Gold forecast and insights on FX majors

Gold forecast could turn brighter after a grey June
Today’s flattish performance of gold mirrors that of last month when gold traded mixed but managed to end as flat as a pancake by the close of play on Friday. The Dollar Index posted a slight monthly gain, indicating that gold investors largely ignored the dollar's strength. Throughout June, gold traded within a narrow range, peaking just above $2387 and bottoming just below $2287. This marked the first month since February without any new record highs, following a series of all-time highs in March, April, and May. The consolidation paused the rally, but no significant reversal patterns emerged to concern bullish investors. After a quieter June, the bullish trend might resume this month.
Gold again shrugs off dollar strength
Despite falling against the euro and weaker-than-expected data from the world’s largest economy, the US dollar still remained largely supported, especially against currencies from countries with more dovish central banks than the Fed, such as the Japanese yen and Chinese yuan. Still, gold investors largely overlooked the forex movements, allowing the metal to recover from its earlier lows. The fact that gold continues to ignore the dollar's strength indicates that investors do not view gold as merely an FX product; instead, they are focused on its appeal for wealth protection against rising prices. After several years of inflation exceeding forecasts and significantly eroding the purchasing power of fiat currencies, gold remains attractive for its value preservation.
US NFP and CPI among key data highlights for dollar, gold
Friday’s latest inflation data, the core PCE price index, met expectations, but more crucial US economic data is expected in the coming weeks, including the June non-farm jobs report on Friday and the CPI on July 11. Additionally, keep an eye on other significant data releases this week, such as the ISM services PMI, ADP private payrolls, JOLTS Job Openings, and FOMC minutes. Given that gold has remained resilient despite a strong dollar, it is reasonable to anticipate a potential rally to a new record high if the dollar starts to weaken from here on. Therefore, monitor the upcoming data releases closely. Any further indications of a weakening US economy could increase expectations for more than one rate cut in 2024, and potentially undermine the US dollar rally, especially against the commodity dollars.
Gold technical analysis
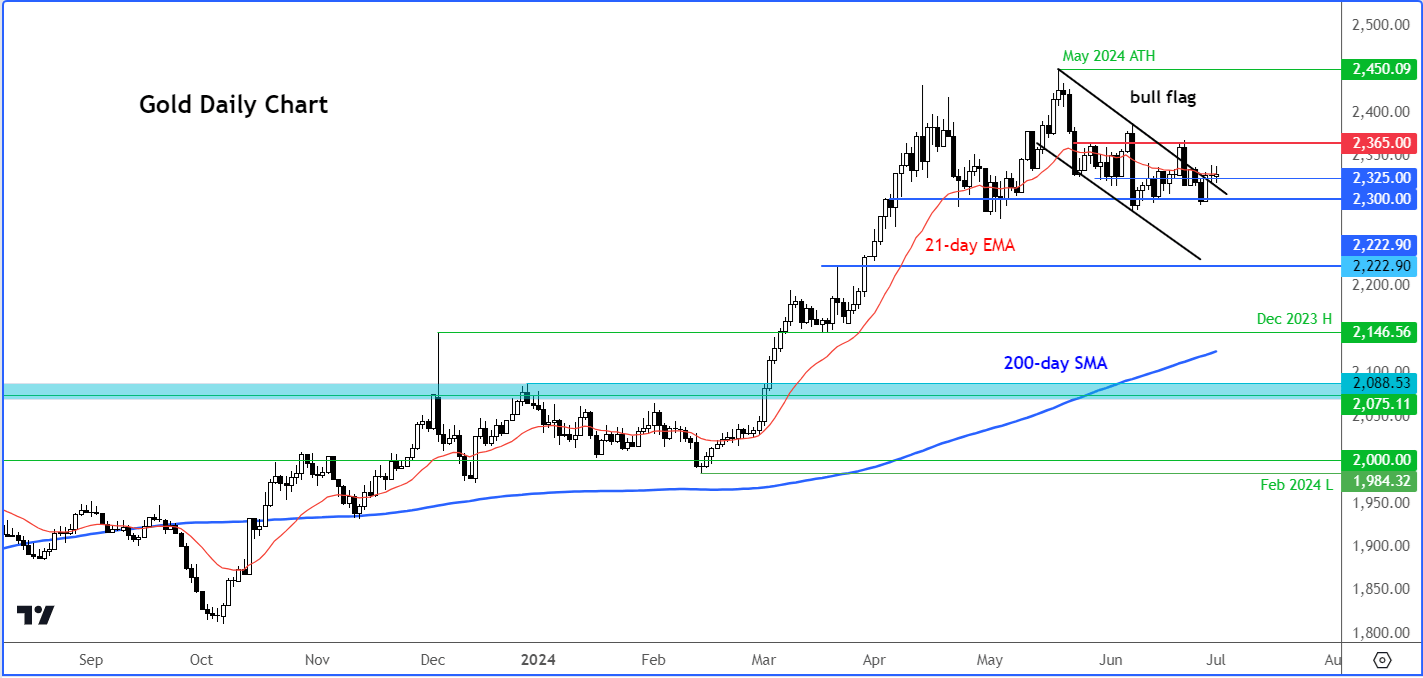
Source: TradingVIew.com
Gold’s recent volatility has muddled the short-term technical picture, but the trend is still bullish on the higher time frames. The consolidation on gold chart has allowed the Relative Strength Index (RSI) to alleviate its 'overbought' conditions across multiple time frames, including the weekly and monthly charts. This has been achieved primarily through time rather than price action, which is generally a bullish sign.
This means that the potential head and shoulders formation observed on the daily time frame could be a bear trap and may not necessarily break down the pattern’s neckline around the crucial $2300 support area. In fact, it could be argued that gold is consolidating within a bull flag continuation pattern, and recent movements suggest a potential breakout. The bears will need to exert significant pressure to shift the trend in their favour.
Now that gold prices have moved above short-term resistance at $2325, the next goal is for it to take out the next key resistance around $2365. A move above this level would strongly indicate that the bull trend has resumed.
Conversely, if the $2300 support level breaks decisively, this could undermine our short-term bullish gold forecast. In this potential scenario, we could expect some follow-through selling towards the next potential support at $2222. However, this is not my base case scenario.
-- Written by Fawad Razaqzada, Market Analyst
Follow Fawad on Twitter @Trader_F_R
How to trade with City Index
You can trade with City Index by following these four easy steps:
-
Open an account, or log in if you’re already a customer
• Open an account in the UK
• Open an account in Australia
• Open an account in Singapore
- Search for the company you want to trade in our award-winning platform
- Choose your position and size, and your stop and limit levels
- Place the trade
Latest market news
Today 03:50 PM
Today 11:13 AM
Today 08:27 AM
Latest Gold articles


June 28, 2024 12:00 PM

June 27, 2024 12:30 PM

June 26, 2024 07:30 PM