

- US nonfarm payrolls, ISM non-manufacturing PMI headline data calendar
- Increased scrutiny of hard economic data over soft surveys likely
- Jerome Powell speaks Tuesday alongside ECB President Lagarde
- Shortened trading week with Independence Day holiday Thursday
At the start of a new quarter, seasonality and holiday trade create the type of environment where US stock indices could easily add to recent gains. But with signs of fatigue creeping in after such a strong rally, are we due a pullback?
Payrolls, ISM PMI headline data calendar
The calendar of top-tier US economic data releases is found below, including the Eurozone inflation report for June which may be influential on US bond markets given the reaction to other inflation reads from around the developed world recently.

While everything carries the ability to move US indices, it’s the payrolls report and ISM non-manufacturing PMI that loom as the key events given increased evidence that US economic activity is starting to cool.
Within the jobs report, you can’t escape that markets will initially react to the headline payrolls figure. But when it comes to what the Fed will be focusing on, it’s the unemployment rate and average hourly earnings figures that screen as more important given the implications for consumer spending and services inflation. Too strong and it may lead to higher bond yields and dollar, impacting borrowing costs and offshore earnings. Too weak and it may indicate the US economy is starting to roll over.
Other than payrolls, the ISM report on Thursday is important as the separate S&P Global US services PMI has been one of the few bright spots in a sea of deteriorating data recently. If the signal from that report is confirmed by the more comprehensive ISM survey it may help ease concerns about the largest sector in US the economy.
Aside from those events, given we’re arguably in the process of shifting from an inflation to growth focus, hard economic data may start to take precedent over soft survey data following the PCE report last Friday.
Powell hits Portugal
Outside of data, the central bank calendar is headlined by the ECB’s Forum in Portugal with ECB President Christine Lagarde speaking alongside Federal Reserve chair Jerome Powell as part of a panel discussion on Tuesday. It’s schedule to begin at the US equity market open.
Elsewhere, New York Fed president John Williams will participate in a panel discussion on the neutral level for interest rates. Given the focus on rate cuts from the Fed, it looms as particularly important for more cyclically dominated equity indices such as the Dow and Russell 2000.
It’s always worthwhile keeping an eye on the updated Fed events website to see whether any unexpected speeches are added to the calendar.
The minutes of the Federal Reserve’s June FOMC meeting are also released on Wednesday, providing more insight behind the committee’s hawkish shift towards guiding to only one rate cut this year from three in March.
Dow Jones (YM)
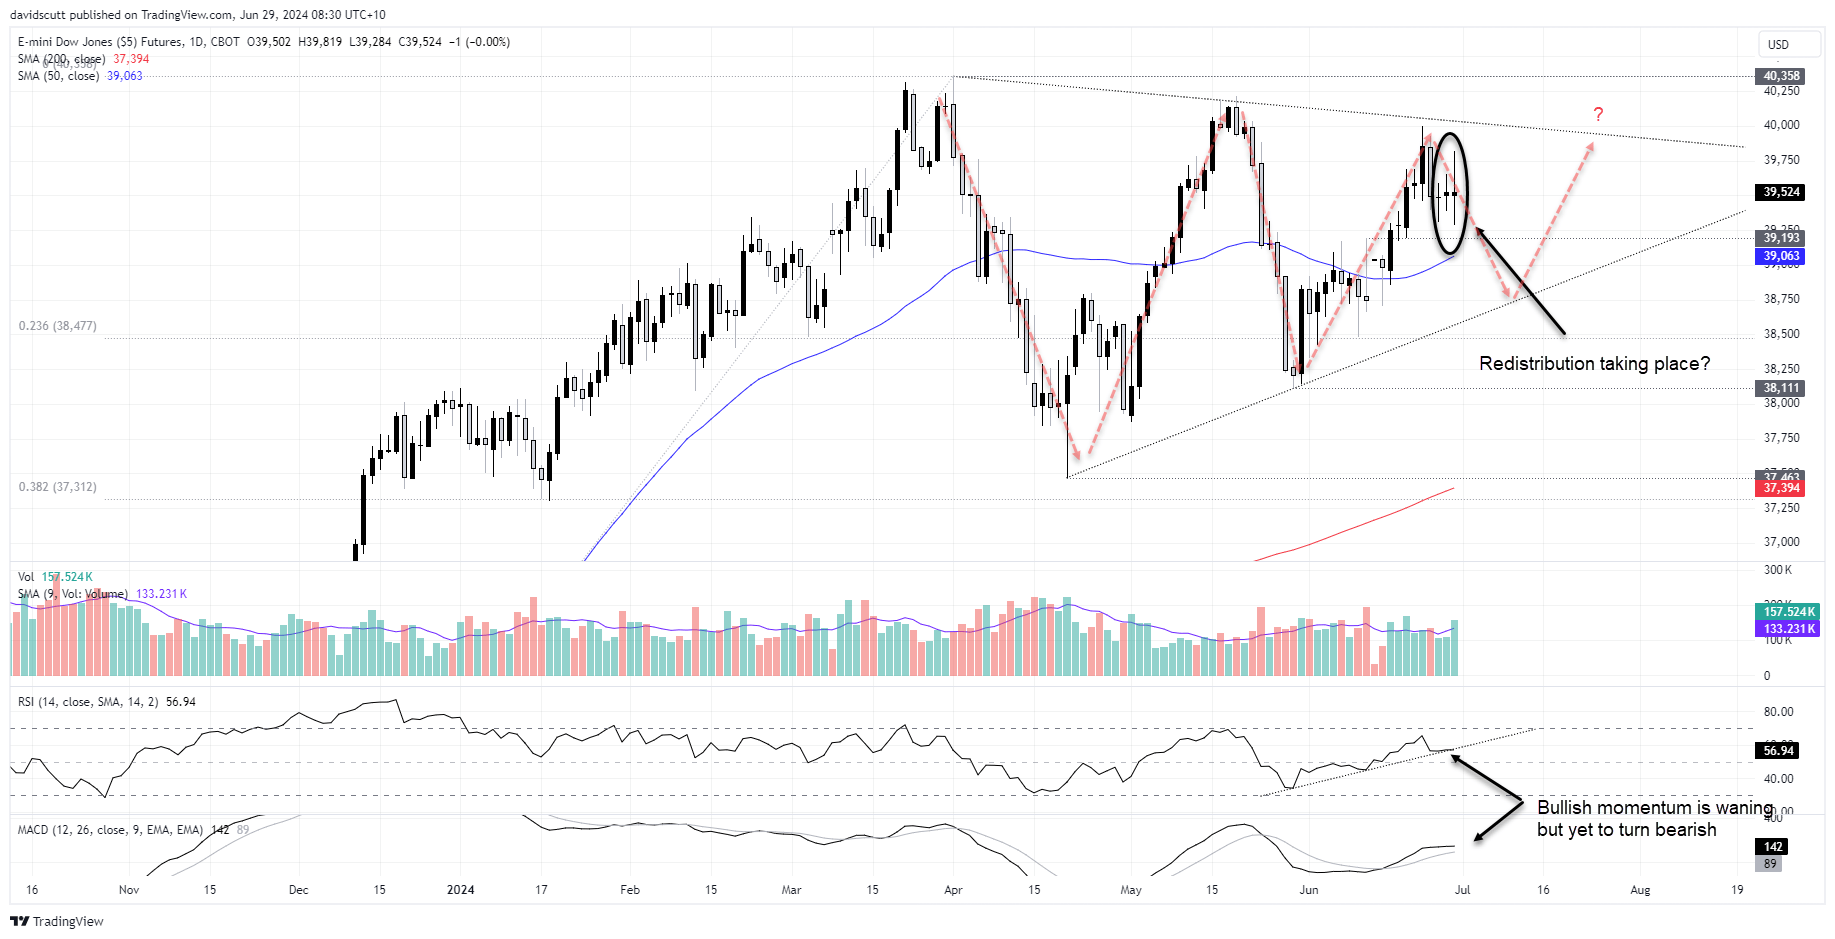
Dow Jones futures looked like they may explode through topside resistance early last week, as convention would suggest when coiling in a pennant pattern. However, futures came close before being rejected, pulling back before printing three consecutive doji candles on the daily.
The price action late last week reeks a little of redistribution, as you may expect towards the end of a quarter. Momentum indicators are yet to turn bearish but the bullish momentum seen throughout June looks to be waning, hinting near-term risks may be skewing lower.
On the downside, 39193, 38477, the 23.6% fib retracement of the Oct-Apr rally, the 50-day moving average and pennant support around 38700 are the support levels to watch. Above, pennant resistance around 40000 is the first level of note with the record high of 40358 the next after that.
S&P 500 futures (ES)
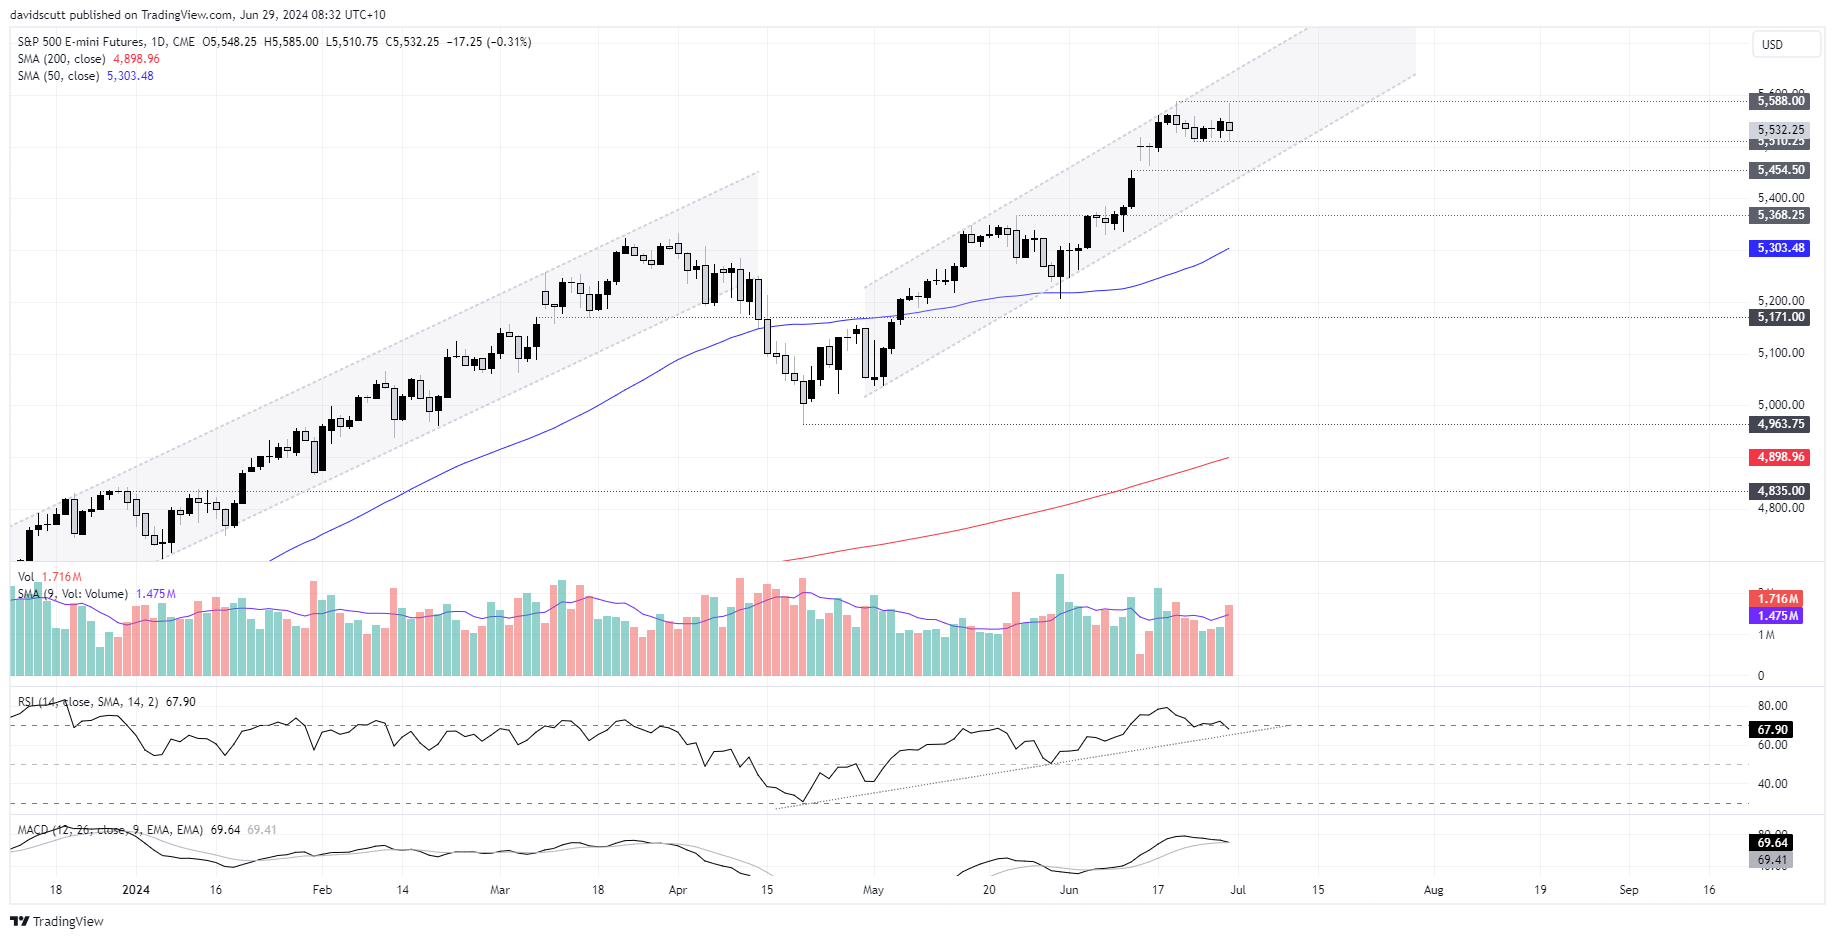
S&P 500 futures sit comfortably in a sideways range within a broader bullish uptrend. The price has been rejected twice at the record high of 5588 over the past fortnight, forcing it back to support at 5510.25. From a momentum perspective, MACD has generated a bearish signal but it has yet to be confirmed by RSI which remains in a solid uptrend.
As discussed below with the Nasdaq, with a gap on the chart at 5454.50 and the price unable to push to new highs, you get the sense we may see modest downside in the near-term. But until the price breaks definitively out of its uptrend, it’s difficult to do anything other than buy dips given the price action this year.
5510.25, 5454.50, 5368.25 and 50-day moving average are the first support layers of note. On the topside, should we see the record highs broken, the market has a tendency to gravitate towards big figures.
Nasdaq 100 futures (NQ)
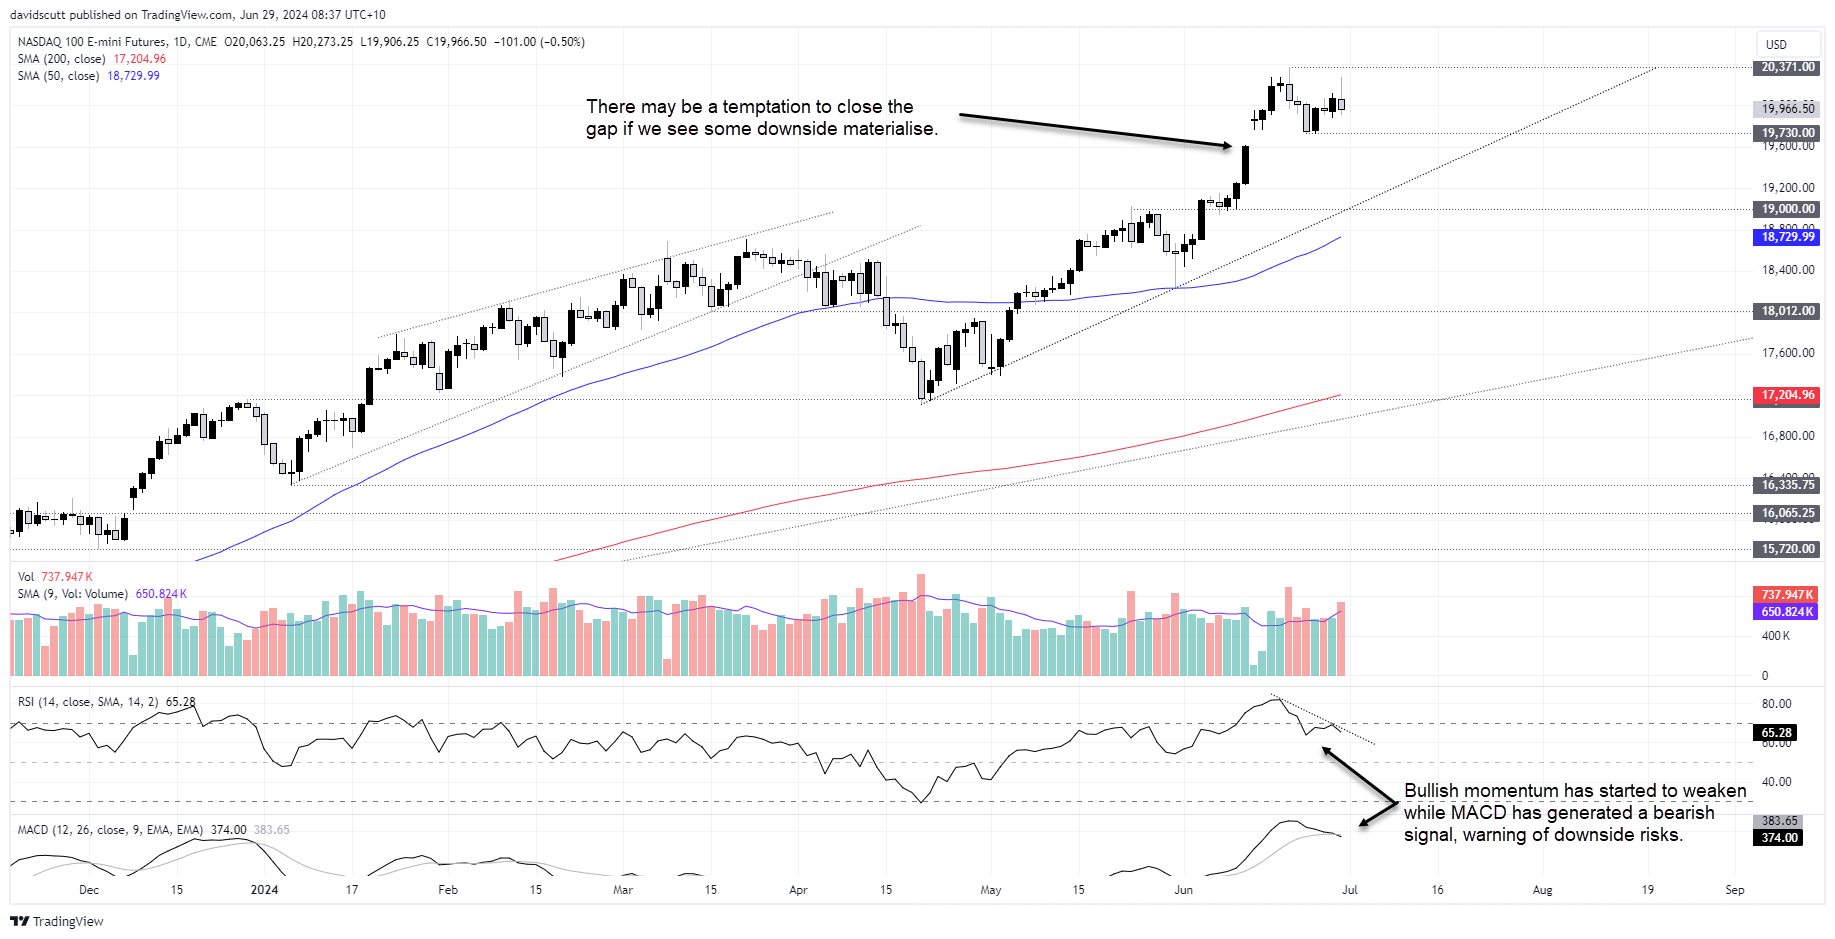
Having gapped higher on June 13, futures have been consolidating in a narrow range between 19730 on the downside and 20371 on the topside. That’s the initial range for traders to play.
While the price action this year has been almost universally bullish, there are some signs of rally fatigue creeping in. Momentum indicators suggest as much with RSI trending lower while MACD has crossed over from above, signalling downside risks.
Should we see downside materialise, watch for the market to attempt to close the gap created by on June 13. It’s located around 19613. Below, the uptrend running from the middle of April, 19000 and 50-day moving average are the next layers of support.
Despite signs of growing downside risk, being the start of a holiday-shortened week and new quarter, don’t discount the risk of the Nasdaq just ripping higher out of nowhere to take out the record highs. If it does, use that as a potential support level to set stop loss orders below if you’re considering buying the break.
Good luck!
-- Written by David Scutt
Follow David on Twitter @scutty
How to trade with City Index
You can trade with City Index by following these four easy steps:
-
Open an account, or log in if you’re already a customer
• Open an account in the UK
• Open an account in Australia
• Open an account in Singapore
- Search for the market you want to trade in our award-winning platform
- Choose your position and size, and your stop and limit levels
- Place the trade
Latest market news
Today 07:55 PM
Today 05:06 PM
Today 04:00 PM
Latest US500 articles

December 23, 2024 02:45 PM

December 23, 2024 01:33 PM

December 8, 2024 08:00 AM

November 26, 2024 06:30 PM