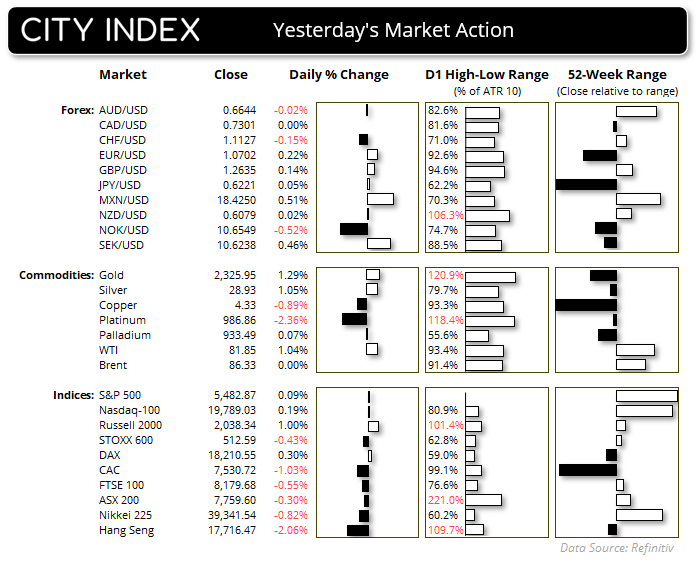
Japan’s officials would like to think they have slowed the decline of the yen to a degree on Thursday, following their latest threats of intervention. However, traders could simply be taking a cautious approach ahead of Friday’s US inflation report.
USD/JPY reached a 38-year high on Wednesday, made more significant by its clear break above both the MOF intervention level set on April 29th and the 160 handle. Yet Thursday only saw a small inside day in the form of a Rikshaw Man doji, just pips beneath the multi-decade high. Still, the yen weakened against the euro and pound, with EUR/JPY and GBP/JPY rising to 32 and 26-year highs respectively. AUD/JPY briefly traded above 107 at its own 17-year high before leaving a small doji, suggesting a hesitancy to rally further ahead of key US data.
USD/JPY technical analysis:

The daily chart is clearly within a strong uptrend, although a slight bearish divergence has formed on the daily RSI (2) within the overbought zone. Still, incoming US inflation data and comments from Japan’s officials are in the driving seat of the direction of the yen’s next move irrespective of overbought levels. Thursday’s range may have been capped by Wednesday’s high, yet support was found at the late April MOF intervention level, making a clear range for traders to keep an eye on for any respective breakout for a longer-term move.
The 1-hour chart shows a solid trend structure, with prices retracing lower from Thursday’s high yet holding above the 20-day EMA. RSI (2) is approaching oversold, so perhaps a swing low could be near and traders could eye another crack at 161.
It seems unlikely we'll see a firm commitment to new highs before the inflation report. This means I'm on guard for any false break and quick reversal below the current level, should we get suckered into a potential bull trap during Asian trading.
Beyond that, note that the 1-day implied volatility band suggests ~66% chance of prices landing between 160.16 and 161.25 by the weekend, which means expected volatility levels are ~170% of their 20-day average.
Fed member Bowman adhered to the Fed script, pushing back on an imminent rate cut, with members generally priming markets for a single 25bp reduction in December. This helped Wall Street indices eke out small gains on the eve of a key PCE inflation report, which is the Fed’s preferred measure of CPI.
WTI crude rose 1% and probed the $82 handle for the first time since late April, hinting at an upside break from its 6-day consolidation since its strong rally closed above $80

Economic events (times in AEST)
In just a few hours we’ll see Joe Biden and Donald Trump verbally spar during their first presidential debate. Although it is expected to be more organised than their last event – as they won’t be able to shout over each other with lessons clearly learned from their last ‘show’. Still, it could prompt some pockets of volatility for traders. And that places US index futures on the radar, which could find some support should Trump tout low interest rates or move lower if Biden’s case is deemed less Wall Street friendly. And with the crypto space increasingly becoming a political tool, traders should also keep an eye on Bitcoin and the like to see if potential policies could be in support of the space.
But first we have Tokyo CPI data which can provide a 3-wee lead for the nationwide numbers. UK GDP figures place GBP pairs onto the radar to see if the economy continues to outperform expectations and push back on BOE cuts. And the highlight is of course the US PCE inflation report, where traders are crossing their fingers for a soft print to revive hopes of more cuts in 2025.
- 09:30 – Tokyo CPI
- 09:50 – Japanese Industrial production
- 11:00 – Presidential debate between Biden, Trump
- 11:30 – Australian housing credit
- 16:00 – UK GDP, business investment, current account
- 22:00 – US PCE inflation
View the full economic calendar
-- Written by Matt Simpson
Follow Matt on Twitter @cLeverEdge
How to trade with City Index
You can trade with City Index by following these four easy steps:
-
Open an account, or log in if you’re already a customer
• Open an account in the UK
• Open an account in Australia
• Open an account in Singapore
- Search for the market you want to trade in our award-winning platform
- Choose your position and size, and your stop and limit levels
- Place the trade


