Vincent Deluard, StoneX global macro strategist, describes how impending stagflation might lead to an equity bear market. That sounds odd since the S&P 500 and Nasdaq 100 have only fallen by around 7% from their July peaks. However, he points out that most stocks have been in a secular bear market for some time. For Deluard, risks abound rising bond yields, widening credit spreads, high valuations, stubborn inflation, a lofty oil price, a rising dollar, and questionable earnings growth.
Is it later than we think?
Deluard argues that stagflation could herald widespread stock multiple contractions, and a broadly based bear market. “Based on my case for a structurally higher inflation target of 4%, the justified Shiller P/E (Robert Shiller’s fair value PE based on inflation and interest rates) should be around 22, down from 31 today.” That’s close to a 30% difference. He adds that higher defense spending could further hurt demand for many companies. “If we assume that defense spending will revert to its Cold War-era average of 8% of GDP, long-term valuations should drop to about 16.” That’s close to a 50% difference.
These are worst-case valuations, but they make an essential point. For headline indices, we are arguably in the longest bull market in history: since the March 2009 low, the S&P 500 has increased sevenfold over fourteen and half years; before that, the 1990s bull market, previously the longest, lasted nine and half years. It might be later than we think.
Stagflation is the major economic risk
The combination of low or no economic growth and high inflation in the late seventies was called ‘stagflation,’ it was characterized by wars in the Middle East, soaring energy costs, loss of trust in institutions, inflation, and a broad crisis of American confidence. Deluard believes we might face something similar in the second half of this decade.
First, he describes the current risks: an economy with a tight labor market and a fiscal deficit of about 7% of GDP. In this scenario, Delaurd believes, we will experience at least a year of stagflation before falling into recession. He thinks this stagflation is already beginning to impact the stock market.
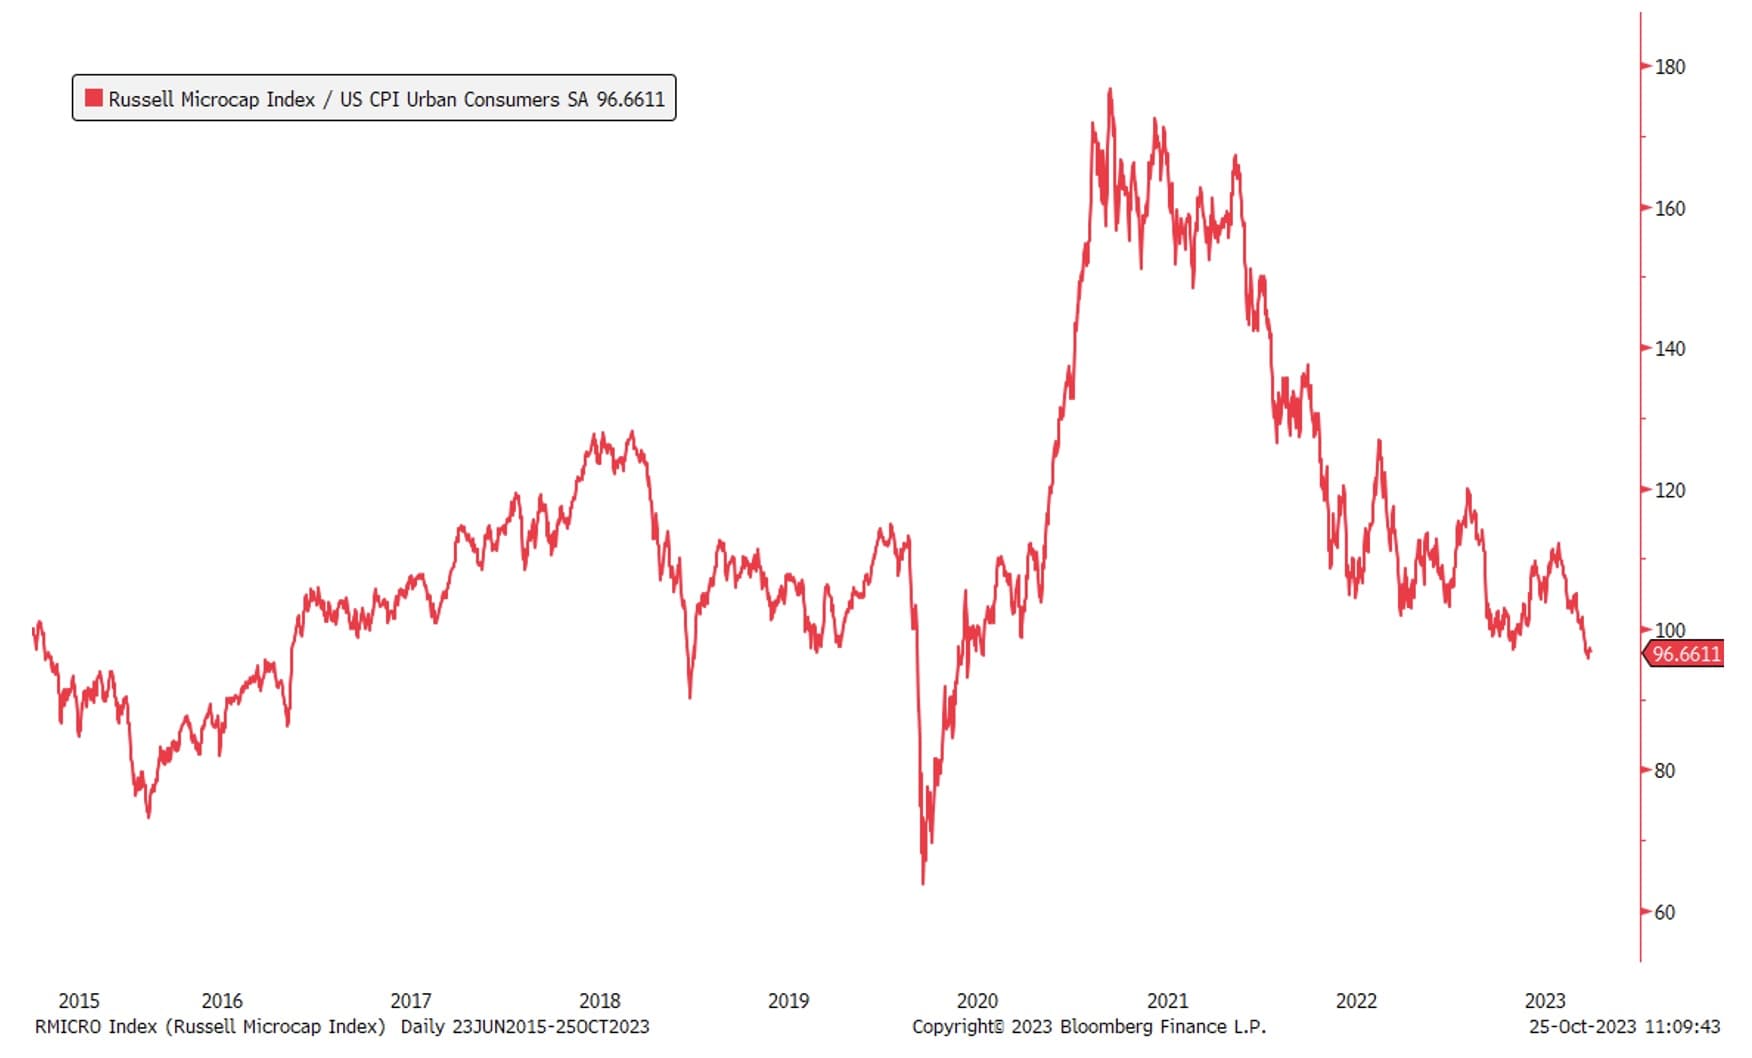
“Small caps have lost 43% in real term since the March 2021 peak and have posted real losses for eight years. 41% of Russell 2,000 companies had negative earnings last quarter, and 15% are “walking dead” firms. The S&P 500 bank index has underperformed inflation for six years, regional banks trade below their Silicon Valley Bank-crisis low, and equity offerings are at a 13-year low.”
Second, he describes the factors that might have masked this phenomenon. “COVID checks, trillions of dollars in quantitative easing, the re-opening after COVID, and the 2023 stealth stimulus kept the economy in an inflationary boom for three years. This likely peaked with last week’s 4.9% GDP report.”
Normal pattern after a secular peak
Deluard believes that equity indices are following the usual cycle after a secular peak:
- Stock multiples peaked in early 2021
- Profit margins rolled over in 2022
- Share buybacks collapsed in 2023
- Finally, market leaders, the magnificent seven tech stocks, stopped outperforming several months ago
He believes that the corporate sector is showing clear signs of stagflation:
- S&P 500 companies raised prices by 6% last quarter, just as they reduced sales volume by 2%
- A record 11 million workdays were lost to strikes in 2023
- Short-term inflation expectations spiked to 4.2%
- Finally, soaring military budgets, energy shocks, and wars lead to stagflation (another unfortunate lesson of the 70s)
Secular bear market already in progress
Deluard argues that we might already be entering a secular bear market, in which stocks experience losses over many years. For example, the Russell microcap index, which covers stocks from rank 2,000 to 3,000 in market cap, has lost 43% in real term since its March 2021 peak, underperforming inflation for the past eight years, and has fallen below its pre-COVID level.
Inflation-Adjusted Russell Microcap Index

Source: StoneX
What have small caps performed so badly?
Delaurd provides several explanations for small-cap performance. First, there has been a dramatic concentration in performance by a handful of mega-cap stocks that benefitted from economies of scale, monopolistic power, the lax enforcement of antitrust laws, and business models that suited the COVID lockdowns.
Second, we have seen steady outflows from the actively managed investment sector, which typically overweight small size and value factors. Small caps benefit much less from the price-insensitive investment approach of indexed funds. Small caps’ valuations adjust more rapidly to economic shocks and changes in asset classes’ relative valuations.
Third, micro-caps rely on bank loans and credit lines rather than long-term bonds to support their capital requirements. As a result, their financing costs are tied to the Fed’s overnight rate. Recent tightening in financial conditions is especially problematic as 41% of Russell 2,000 companies had negative earnings last quarter. Some 15% are “walking dead” firms whose operating cash flow does not cover their interest costs, and their cash balances cannot fund their operating expenses.
On the other hand, Blue Chips issued long-term bonds during the lockdown years, protecting them from interest rate hikes, and they often gain interest income on their significant cash balances.
Bank stocks seeing negative returns
Deluard highlights banks under pressure. The real returns on bank’s capital have been negative for many years. The S&P 500 bank index has underperformed inflation for six years, regional banks now trade below their SVB-crisis low of earlier this year, and two of the big four banks, Citi and Wells Fargo, are worth less than their tangible book value. Banks have faced very low levels of capital market activity, with few IPOs and mergers, slim interest rate margins, and modest net interest income growth.
How bull markets become bear markets
Deluard describes how bull markets turn into bear markets. Multiples peak when the economy is overheating. However, this overheating brings inflation, and rising costs eventually erode margins. Profit growth slows. Companies strapped for cash reduce share buybacks. As time passes, the bull market narrows to just a handful of stocks. “When these mega-caps roll over, the bear market becomes most visible as stock multiples, profit margins, and share buybacks all fall simultaneously,” Deluard observes.
Let’s consider two of these risk factors in more detail.
Passing the peak for profit margins …
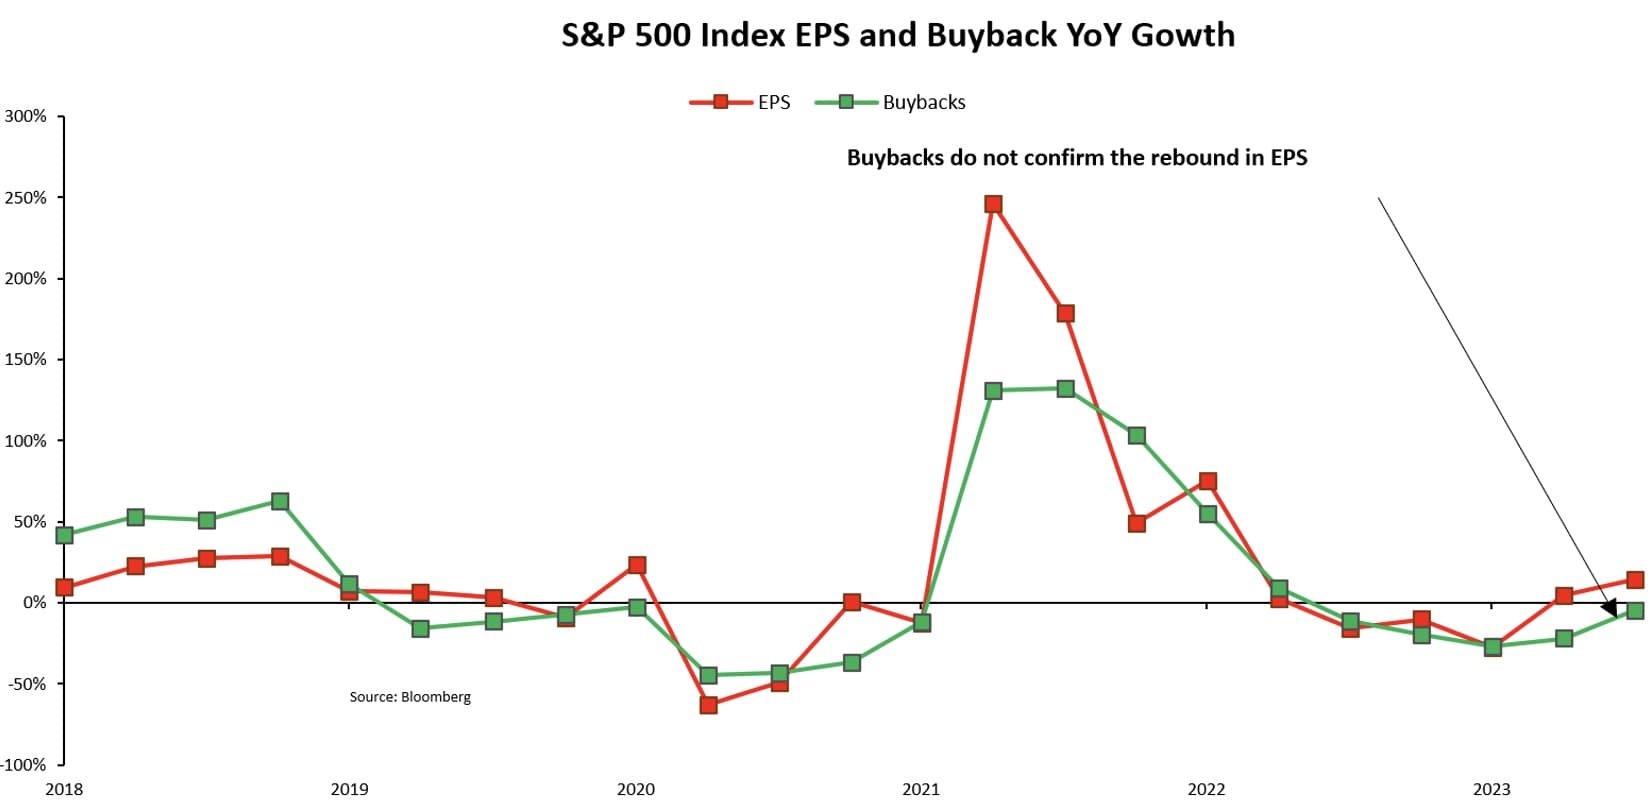
The profitability of the S&P 500 has dropped for nine straight quarters, excluding the most prominent five companies and adding in energy stocks that have benefited from the high oil price. This profit margin erosion happened despite nominal economic growth averaging 9.5% since 2016. Bullish analysts are pinning their hopes on a rapid rebound of earnings and share buybacks:
- S&P 500 operating earnings are expected to grow by 12.0% in 2024 and 12.3% in 2025
- Buybacks remain 5% lower than they were last year; companies favor capital expenditures (+15% in 2023) and cash balances (+9% in 2023) over shareholder payments
S&P 500 earnings growth and change in share buybacks
 Source: StoneX.
As Deluard says, “It’s hard to imagine margins improving when the economy slows next year.” Yet, this is precisely what analysts forecast. The margins of Apple, Microsoft, Google, Meta, and Amazon are expected to exceed their 2021 peak by the end of next year. This seems to ignore that these record margins resulted from a one-time event – lockdowns, stimulus checks, excess savings, and a shift to online spending.
S&P 500 Profit Margins
 Source: StoneX.
Passing the peak for stock multiples …
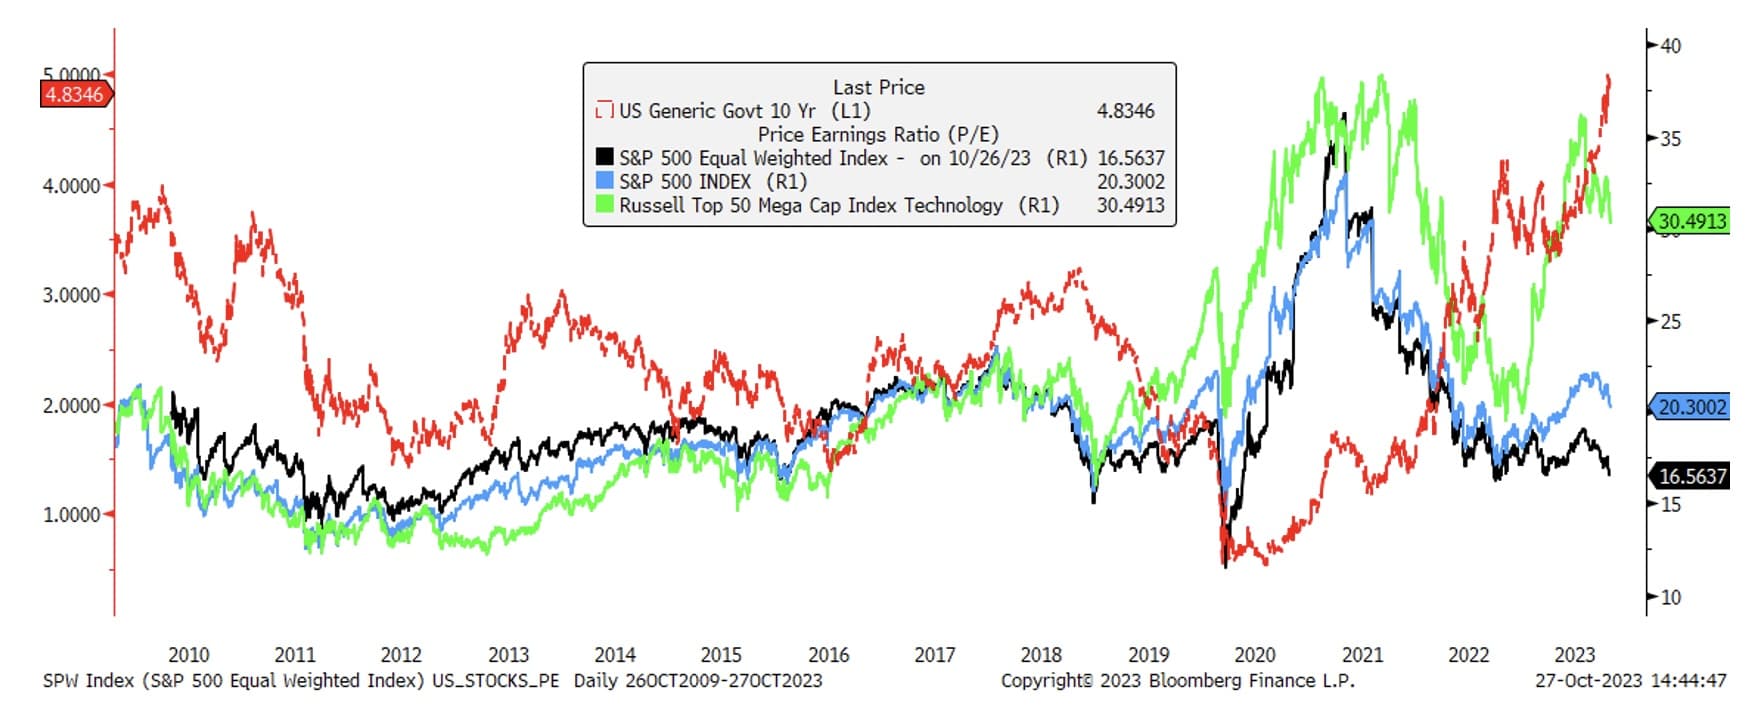
The chart below shows the vast disparity between the 30.5-times PE of the Russell Top 50, 20.3-times for the S&P 500 index, and 16.6-times for the equally-weighted S&P 500 index (removing size distortions.) “In the first internet bubble, multiples peaked in early 1999, and broad indices rolled over in late 2000. It has now been about two years since the 2021 peak in valuations,” Deluard observes.
Valuations of Major US Indices
 Source: StoneX.
Analysis by Vincent Deluard, CFA. Director, Global Macro Strategy. vincent.deluard@stonex.com
Financial reporter: Paul Walton. Paul.walton@stonex.com


