- Crude oil inventories increased with a 1.8M change
- Natural gas inventories are expected to increase by 14B today
- Inflation rates persist and FOMC minutes reflect worries
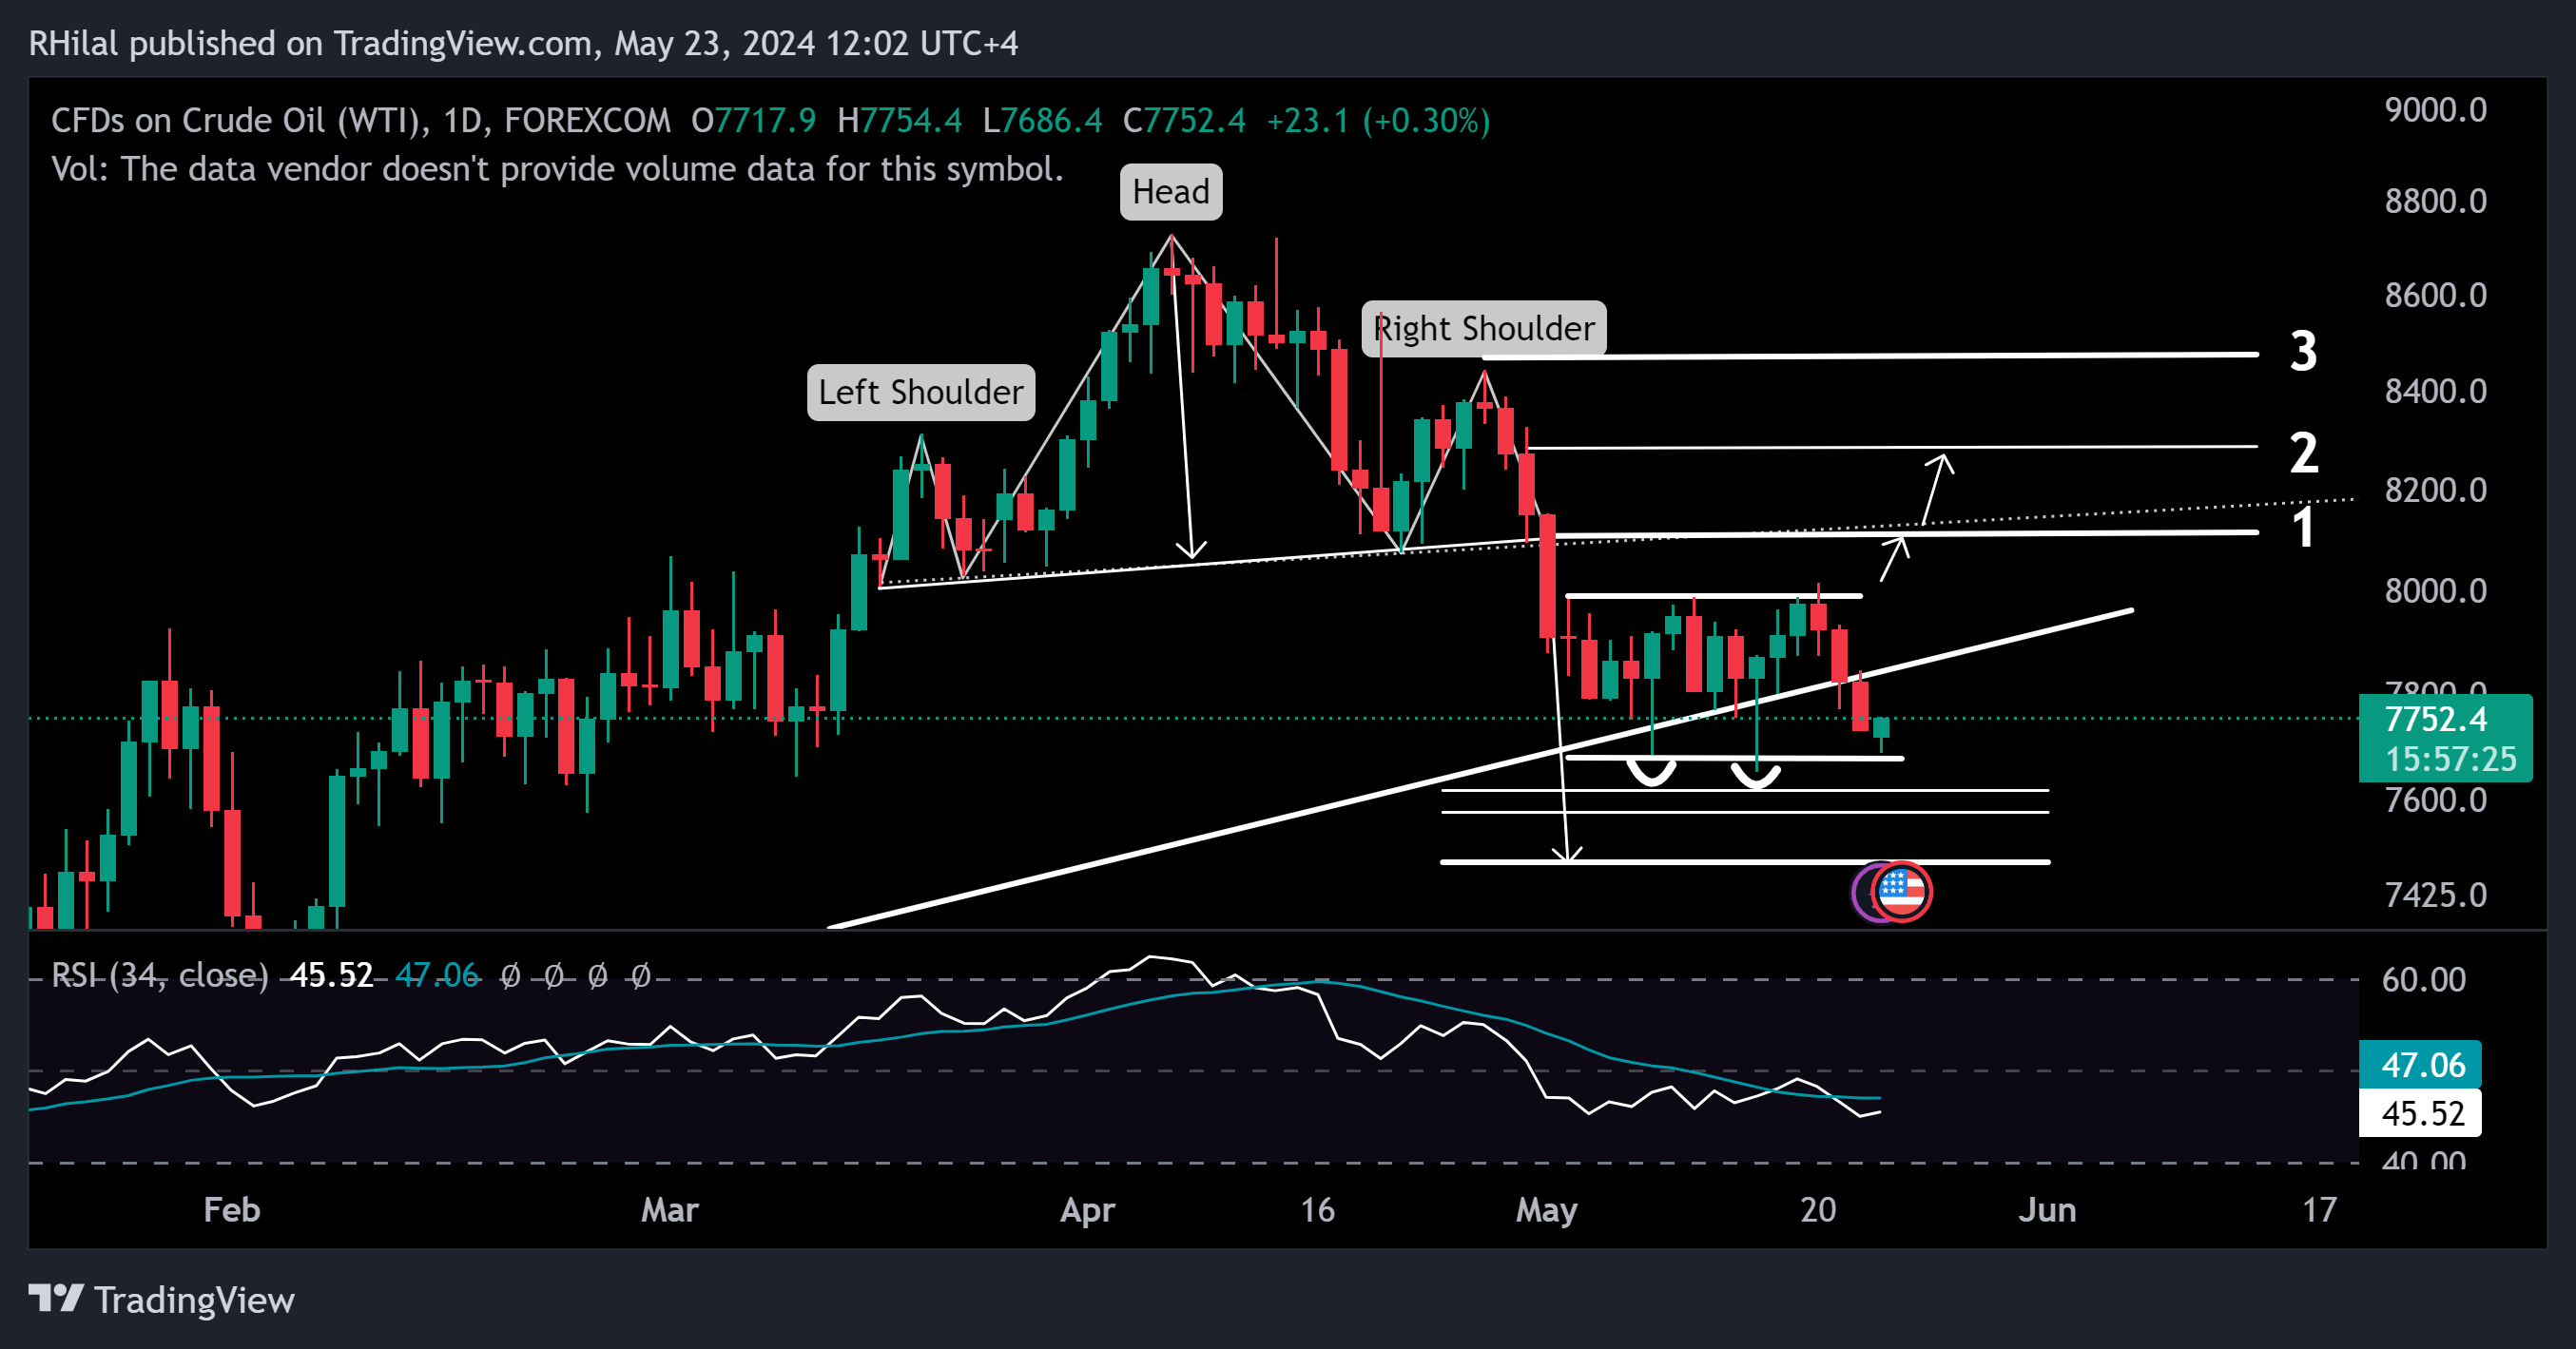
Crude Oil inventories did not keep up with the two-week streak of decreasing supply trends and recorded a 1.8M positive change. Prices have touched down today at a 76.86 low and bearish to neutral momentum is still dominating the chart, raising a question to the oil trajectory onto Q2.
From a natural gas perspective, In Q1 2024, prices surged to four-month highs of 2.94 bch, driven by increased demand from China, which holds a 40% share of global demand. China's accelerating economic growth and expanding gas infrastructure are pushing prices higher.
Looking at factors from a long-term outlook, Natural gas acts as a bridge between current carbon emission plans and the transition to renewable energy, emitting less CO2 than oil and coal. This positions it favorably for medium-term demand towards 2030, though sustainability of demand and prices remains uncertain amid aggressive carbon emission policies favoring renewables by 2060.
From a shorter-term outlook, the current supply and demand interplay is fueling bullish trends. Natural gas storage has dropped for three consecutive weeks, exceeding expectations, and pushing prices close to 3 bch.
Quantifying the levels for the current market developments
USOIL – Daily Time Frame – Logarithmic Scale

Crude oil prices remain within May's range, fluctuating between a high of 80.14 and a low of 76.50. A breakout from this range is crucial to confirm a downside continuation near 74.80 and or an upside breakout towards 81 and 83, respectively. FOMC minutes reflected worries around persistent inflation rates, a slowing economy, and a potential for unchanged rates until September. Given a contractionary outlook, oil demand potential reflects similar uncertainties, and supply cuts are needed to potentially revive its trend.
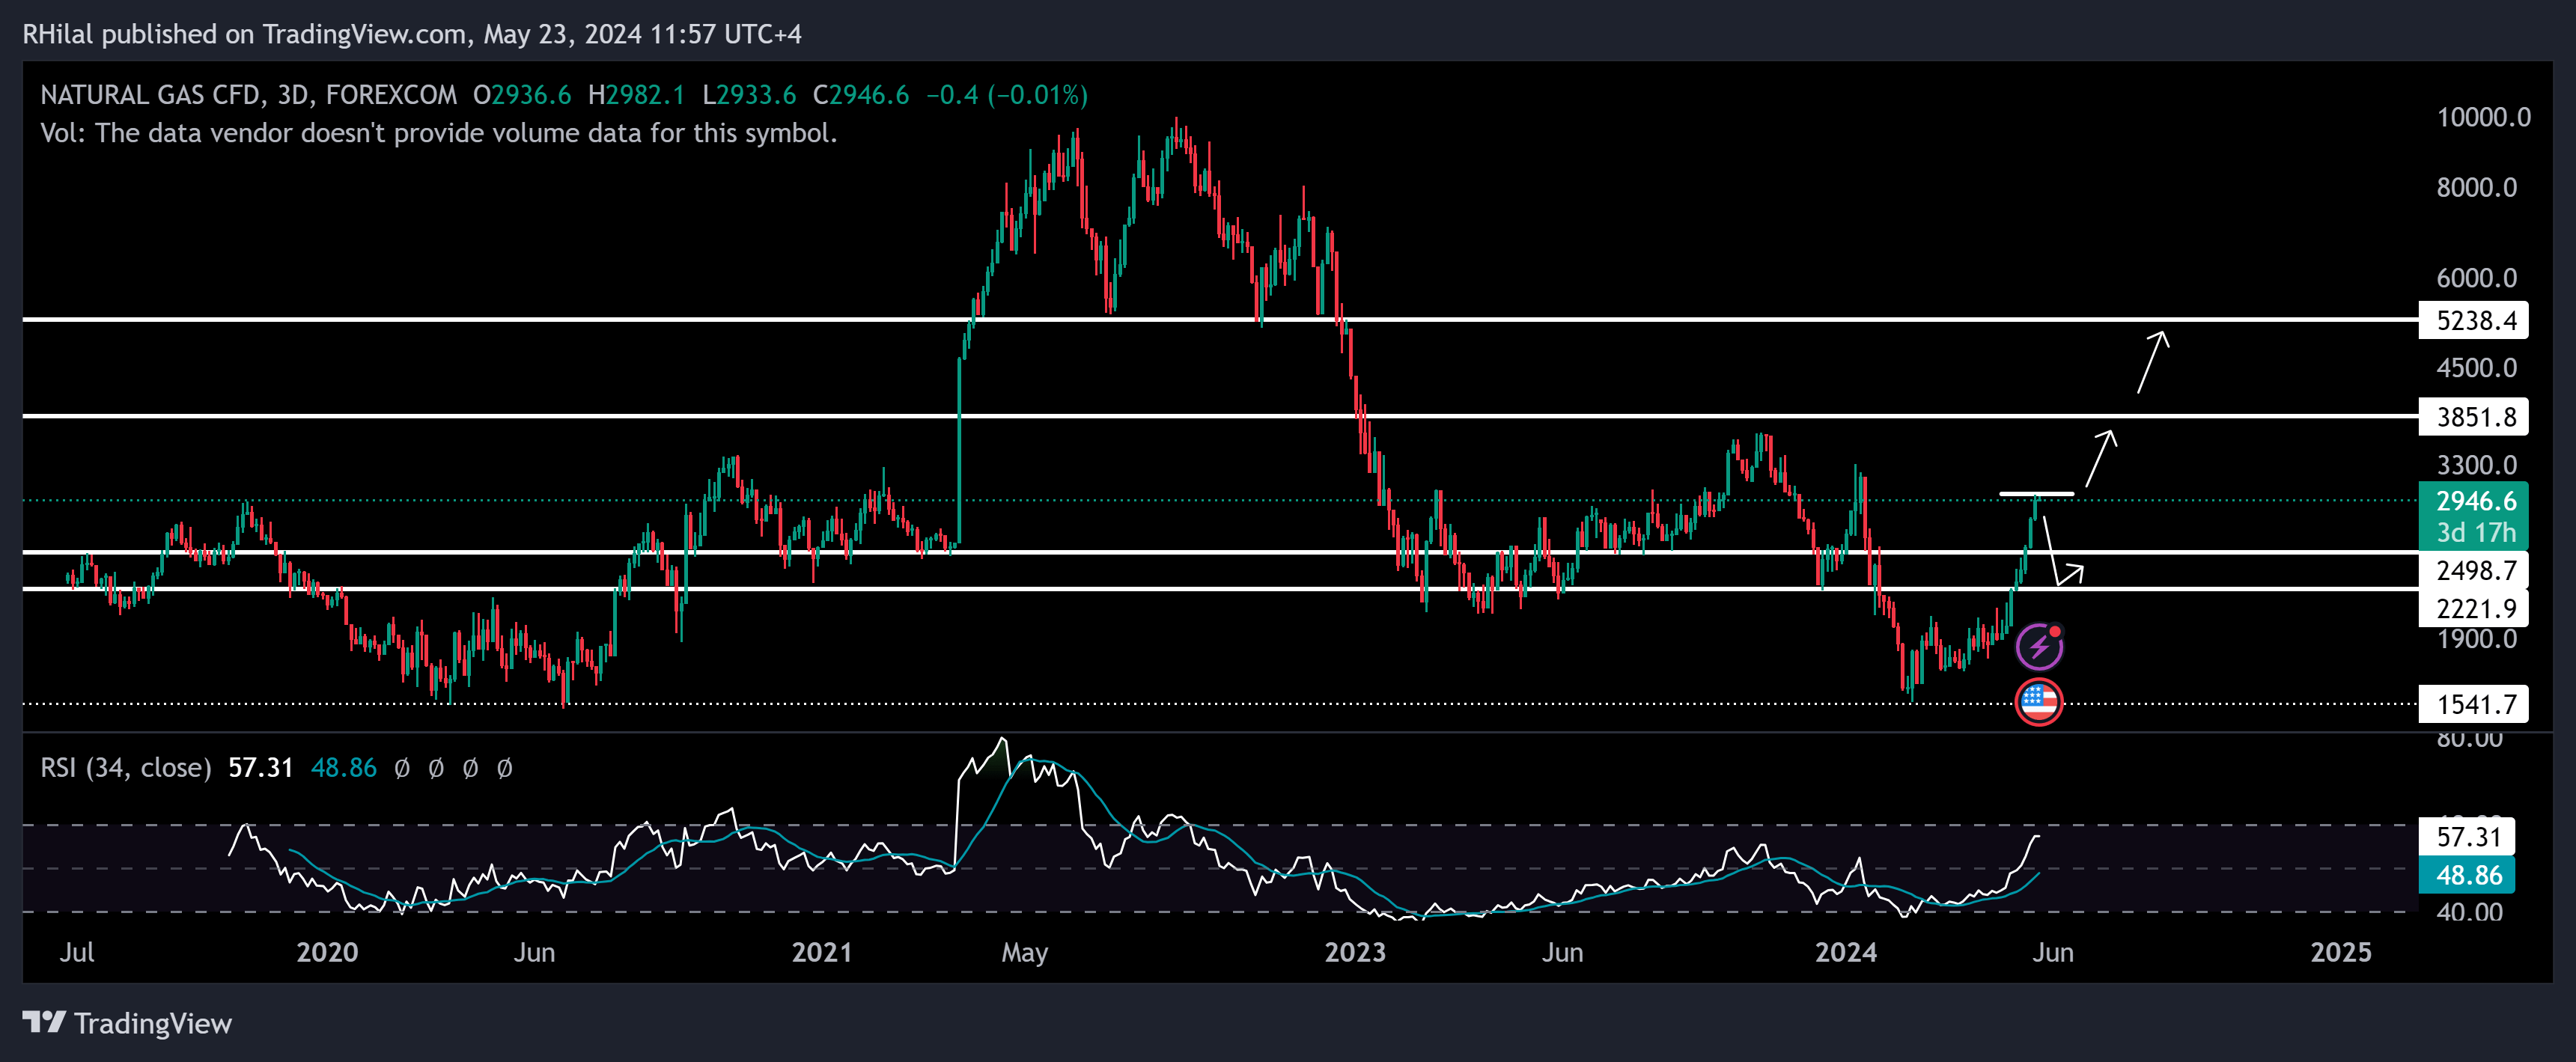
Natural Gas – 3Day Time Frame – Logarithmic Scale

As demand dominated supply potential in February 2024, the trajectory of NGAS has flipped to the upside from the 1.5 low towards the 2.99 high. From a relative strength index perspective, we are near the extremities of a stretched trend. Given strong demand potential, the trend can continue towards 3.63, 3.85, and 5.24 consecutively, given the breakout above 3.1. On the downside, potential support levels are at 2.5 and 2.2, where prices might consolidate and recharge.
Looking at these markets from sustainable vision perspective, towards green agendas and industrial decarbonization plans, current economic expansions can boost the charts upward, if they were to continue. On an extended note, long-term price sustainability is uncertain when renewable resources take the light.


