

Australia's uncomfortably high inflation report last week means there is a real risk the RBA could now hike rates by 25 basis points (bp) at their August meeting. Not only has the inflation rate been creeping higher this year, but its pace has also accelerated, with headline CPI rising to 4% year-over-year (y/y). The government's recently announced 'cost of living crisis' policies are also inflationary. And while it is debatable whether another hike will actually help reduce inflationary pressures, the RBA may simply want to be seen taking action to try and stem it. It goes without saying that the tone of the meeting will now be very hawkish, even if consumers are somehow treated to another hold at 4.35%. Right now, that seems unlikely.

RBA cash rate futures imply a 45% chance of a 25bp hike at the RBA’s next meeting on the 6th August. The 1-month OIS (overnight index swap) suggests a 65% chance of a hike, which I suspect is more realistic. Morgan Stanley, UBS and Citi are all backing a hike.
The RBA minutes will of course warrant a look a look on Tuesday, but we already know the RBA discussed a potential hike versus a pause at their last two meetings, with no mention of a cut. Although it is mostly US data which is likely to be in the driving seat for AUD/USD traders this week. And with US economic data slowly souring, it suggests further upside potential for AUD/USD, assuming appetite for risk remains supported.
The Fed’s preferred inflation gauge was softer than expected on Friday, with core PCE rising just 0.1% m/m or 2.6% y/y. Super core PCE matched those same number, sending odds of a 25bp Fed cut in September up to 55.2%.
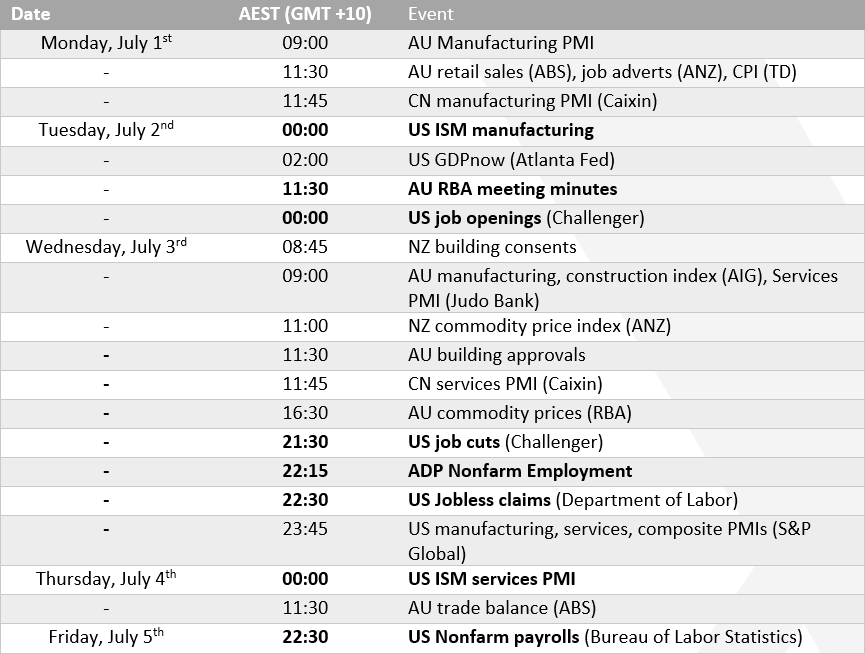
A host of US employment data, including Challenger job cuts, JOLTS job openings, jobless claims, and ADP and NFP employment reports, will be released. We also have key business sentiment readings via the ISM manufacturing and services reports. With traders still keen to reprice Fed cuts (despite the Fed's insistence on a single cut in December), I suspect markets will place greater emphasis on weak US data than on strong data. This could help support AUD/USD through a weaker US dollar and improved risk appetite. However, this theme becomes strained if incoming US data is too weak (to the point where it suggests the Fed has finally broken the economy). This would likely weigh on risk appetite and, therefore, on AUD/USD.

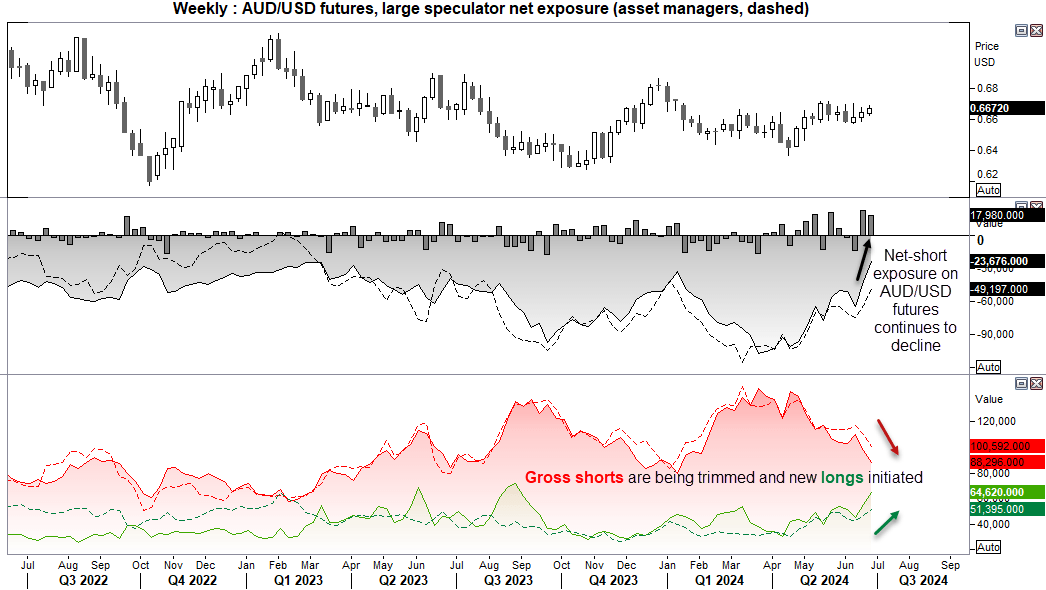
AUD/USD futures – market positioning from the COT report:
- Net short exposure among large speculators felt the least bearish level in three years
- Gross shorts fell to a 24-week low and gross longs rose to 44 week high
- we suspect traders will be even less bearish in the next report given inflation data came in so hot last Wednesday
- We're seeing a similar pattern among asset managers with net short exposure falling to a six-month low, I and again a mixture of increased longs and fewer shorts
- With US economic data deteriorating and speculation that the RBA could in fact hike rates, it seems just a matter of time before futures traders revert to net long exposure
AUD/USD technical analysis
The the Australian dollar rose for third consecutive week, although it remains range bound between the June low and may high. 67 cents has been a clear hurdle the bulls have not been able to clear just yet, but a case for bullish breakout could be building.
If US data continues to deteriorate this week, a bullish breakout could be on the cards sooner than later as the Australian dollar could get swept higher with broad risk on sentiment. If US data outperforms expectations, then perhaps the Australian dollar will pull back within range but ultimately it remains a pair for bulls to seek dips in the current climate.
The daily chart shows a strong rally from the April low to the May high, which favours an eventual break higher from the range. More recently within the range, a series of higher lows have formed to show that bullish pressure could be slowly building. Take note of the daily RSI (2) is overbought so perhaps a small pullback is due first. But the bias remains bullish whilst prices remain above the 0.6620 low, and for a retest of the May high.

-- Written by Matt Simpson
Follow Matt on Twitter @cLeverEdge
How to trade with City Index
You can trade with City Index by following these four easy steps:
-
Open an account, or log in if you’re already a customer
• Open an account in the UK
• Open an account in Australia
• Open an account in Singapore
- Search for the market you want to trade in our award-winning platform
- Choose your position and size, and your stop and limit levels
- Place the trade
Latest market news
Today 07:15 PM
Today 04:10 PM
Today 12:30 PM
Today 09:44 AM
Latest AUD/USD Weekly Outlook articles

December 15, 2024 10:54 PM

December 8, 2024 11:51 PM
December 1, 2024 11:06 PM
November 25, 2024 12:31 AM