
H2 2024 Crude Oil Outlook: Oil Bulls Defend Support- 2023 Consolidation Breakout Pending
Key points for the Oil 2024 outlook
- Oil rally fails to breakout of 2022 downtrend – prices plunge more than 17%
- US oil production remains near record highs- refining capacity rebounds headwind
- FOMC outlook / global demand prospects remain supportive
- Technicals point multi-year consolidation breakout- constructive above 74.28
Crude Oil Q2 Review
In our Q2 oil price outlook we noted that, “A three-month rally off support has WTI testing major technical resistance into the close of the March- the focus is on possible price inflection off this zone.” The region in focus was around the 61.8% retracement of the 2023 decline at 84.57 – price ripped through resistance in early April (registering an intraweek high at 87.63) with a brief two-week stint reversing sharply lower. A decline of more than 17.3% off the highs exhausted into critical support in June and the focus now shifts to a possible breakout of the multi-year consolidation range heading into Q3.
World Growth & Oil Production
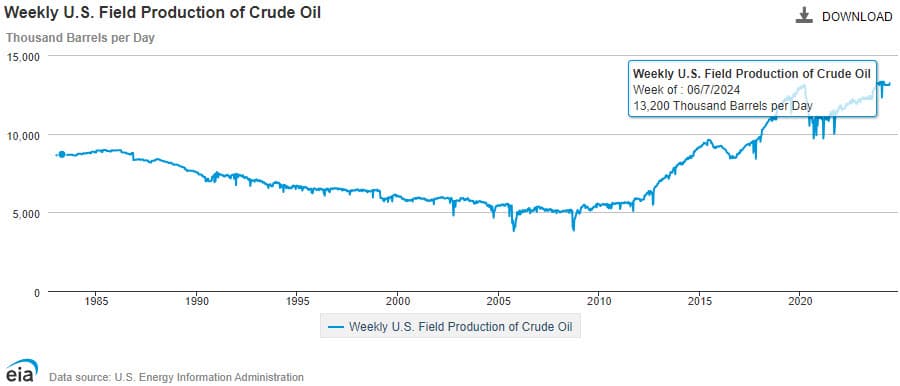
US weekly output has now reached the 2020 highs with the Energy Information Administration (EIA) highlighting current weekly production at 13.2 million barrels a day. With OPEC+ members extending the voluntary production cuts until the end of December 2025, the offset keeps the broader supply outlook relatively stable.
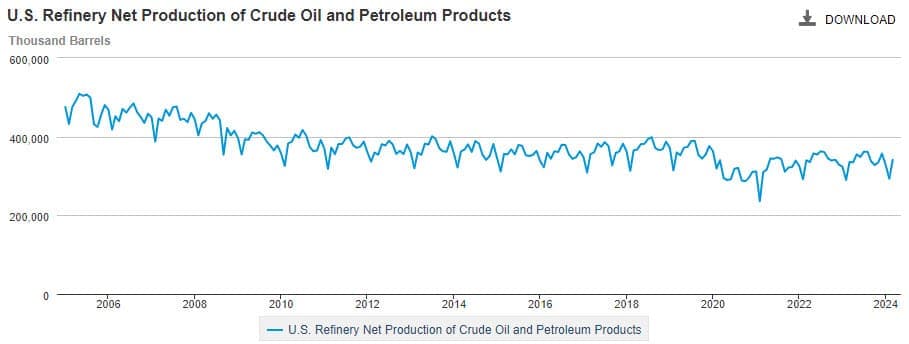
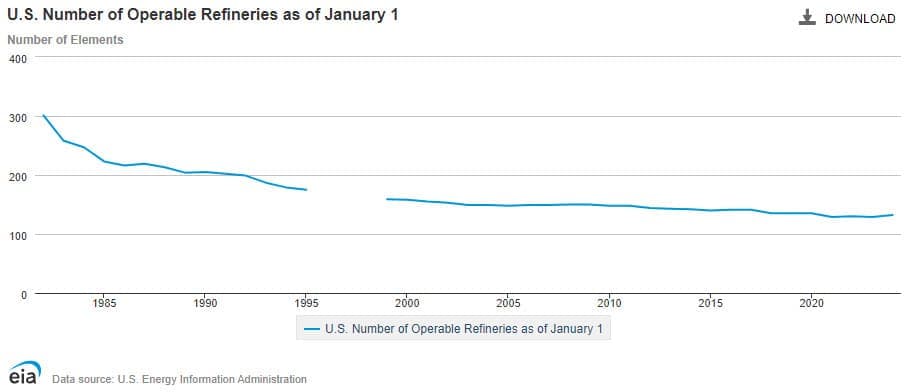
We’ve also continued to note that despite the increase in crude field production, US refining capacity remains constrained. Although we’ve seen a slight uptick in refining output, it’s worth nothing that only three-additional refineries (currently 132) have come online since the 2021 lows. This topic is not currently in the mainstream, but something that may weigh on the outlook for US output as global demand increases.
The FOMC’s latest Summary of Economic Projections (June), highlighted expectations for steady economic growth into the close of the year with the committee forecasting 2024 real GDP at 2.1% despite increasing the inflation outlook in both headline and core PCE (personal consumption expenditure). While much of the interest rate outlook will hinge on incoming inflation data, markets are still anticipating the Fed to ease this year with Fed fund futures suggesting a 70% chance for a cut in September. Bottom line: with rate-cuts seemingly on the horizon, strong demand in air travel, and summer driving season in full swing, the demand picture for oil remains supported heading into Q3.
The OPEC June Monthly Oil Market Report anticipates global demand to reach 104.5million barrels per day in 2024, and when combined with expected central bank easing in the US, the Eurozone, and the UK, the outlook for crude remains supported heading into Q3 from a supply / demand perspective.
Crude Oil Technical Outlook
Oil Price Chart - WTI Weekly
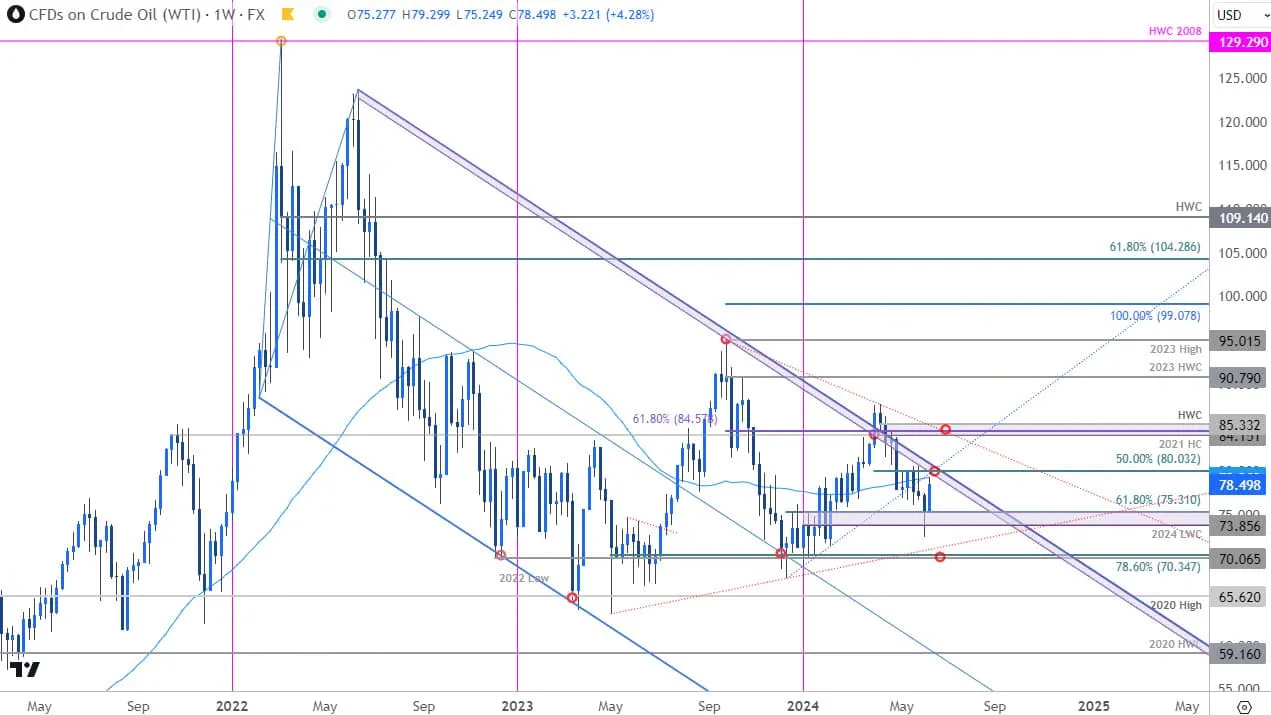
Chart Prepared by Michael Boutros, Technical Strategist; WTI on TradingView
The bulls made a strong defense of key support in June at 73.85-75.31- a region defined by the 2024 low-week close (LWC) and the 61.8% Fibonacci retracement of the December rally. WTI has rallied more than 9.4% off those lows with price now testing resistance at the 52-week moving average.
Oil Price Chart - WTI Daily
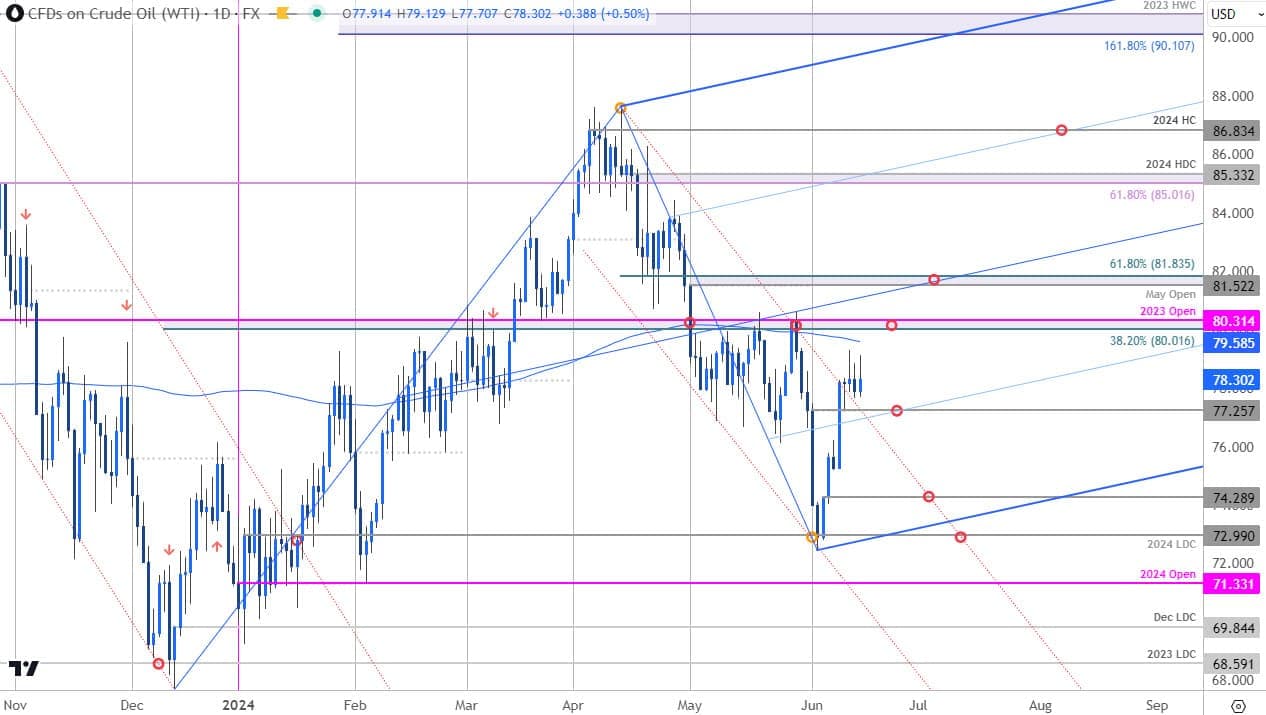
A closer look at the daily chart shows WTI marking a V-Shaped recovery off the confluent support at the yearly low-day close (LDC) at 72.99. Initial resistance is now eyed at the 200-day moving average / 38.2% retracement of the December rally / 2023 yearly open at 79.58-80.31 and is backed closely by the May open / 61.8% retracement of the April decline at 81.52/83- a breach / weekly close above this threshold is needed to fuel the next major leg in price. Subsequent resistance objectives are eyed at the 61.8% retracement of the 2023 decline / yearly high-day close (HDC) at 85.01/33 and the objective 2024 high-close (HC) at 86.83- both areas of interest for possible exhaustion / prince inflection IF reached.
Initial support rests with the June open (77.25) and backed by the June 5th reversal close at 74.28 and the 2024 low-day close (LDC) at 72.99- a break / weekly-close below this threshold would threaten resumption of the broader downtrend towards the yearly open at 71.11 and beyond.
Bottom Line: A failed attempt to breakout of the 2022 downtrend has reinforced the focus on a breakout of this year-long consoldiation formation off the May 2023 low (red on weekly chart). Heading into Q3 the focus is on breakout of the 73.85-85.33 range for guidance on our medium-term directional bias. From a trading standpoint, losses should be limited to 74.28 IF price is heading higher on this stretch with a breach above the median-line (81.83) needed to fuel the next major move.
--- Written by Michael Boutros, Sr Technical Strategist with FOREX.com
Follow Michael on X @MBForex