AUD/USD H2 2024 Outlook
Key points for the AUD/USD in H2, 2024
- The RBA are unlikely to change their cash rate this year
- Australia’s economy and inflation is slowing, but gradually
- AUD/USD could continue to grind higher with dips being bought above 64c in H2
- Seasonality tends to see a weak performance in Q3 and stronger in Q4
- Quarterly volatility has hit a -year low and risks being suppressed
- We anticipated AUD/USD to trade between 62c-68c in Q2
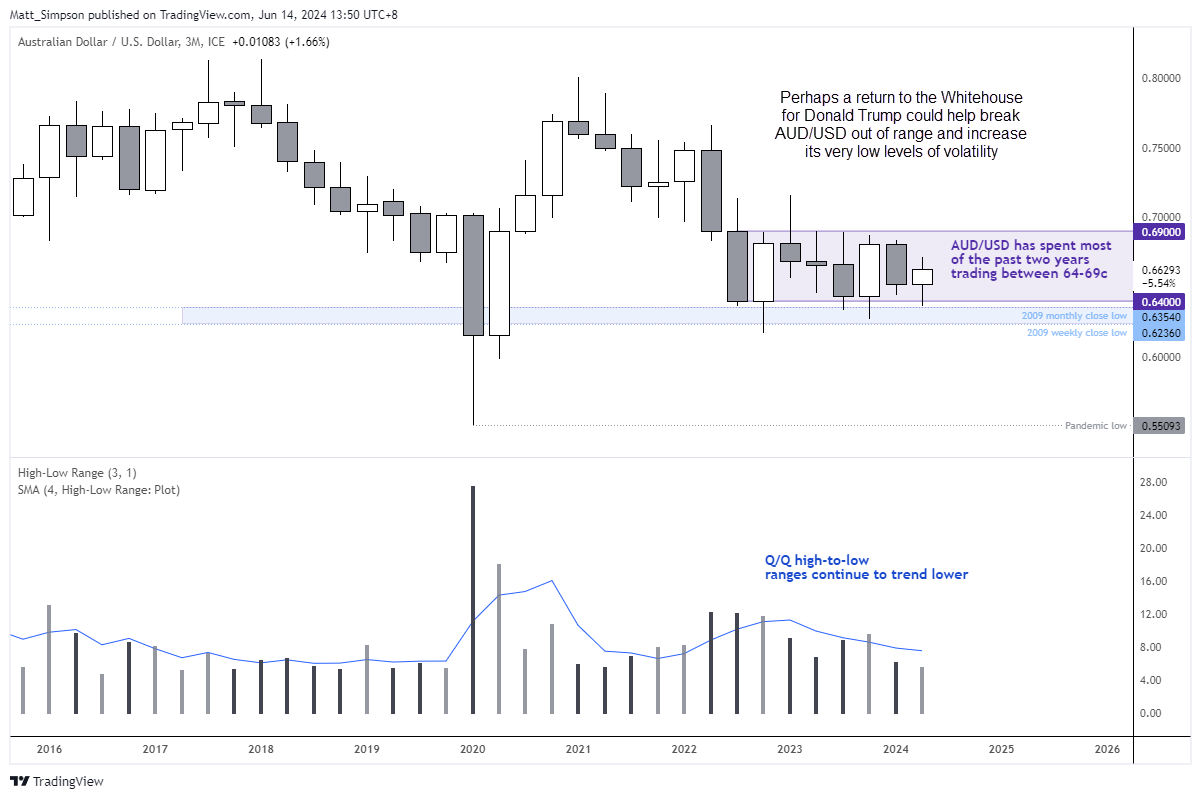
- Unless Trump returns to the Whitehouse and brings the risks of lower interest rates and trade wars
The RBA can likely clock out for H2
The RBA haven’t been the most exciting central bank to be following in recent months, simply because they have had little to do. Pockets of weakness in the economy are being matched with areas of strength elsewhere. And that is keeping the RBA in a neutral stance with a very slight hawkish bias in their statement – mostly as a ‘just in case’ precaution.
However, we get a mixed picture if we look at similar economies such as New Zealand and Canada. The Bank of Canada (BoC) just cut rates and may have the potential to cut further, yet the Reserve Bank of New Zealand (RBNZ) threw a hawkish spanner in the works by discussing a hike at their last meeting. And with New Zealand being a key trade partner with Australia, it provides another reason to be skeptical of a rate cut by the RBA. Australia's 1-year overnight index swap (OIS) estimates just a 7bp cut from the 4.35% cash rate.
The Federal Reserve (Fed) finally succumbed to economic strength and now sees just one cut in 2024. While four cuts are favoured in 2025, inflation forecasts were also upgraded. If the Fed is less likely to cut, so is the RBA. However, if the Fed continues to signal cuts for 2025 as we get into the second half of the year, it could support AUD/USD on expectations of a narrower yield differential between the Fed and RBA.
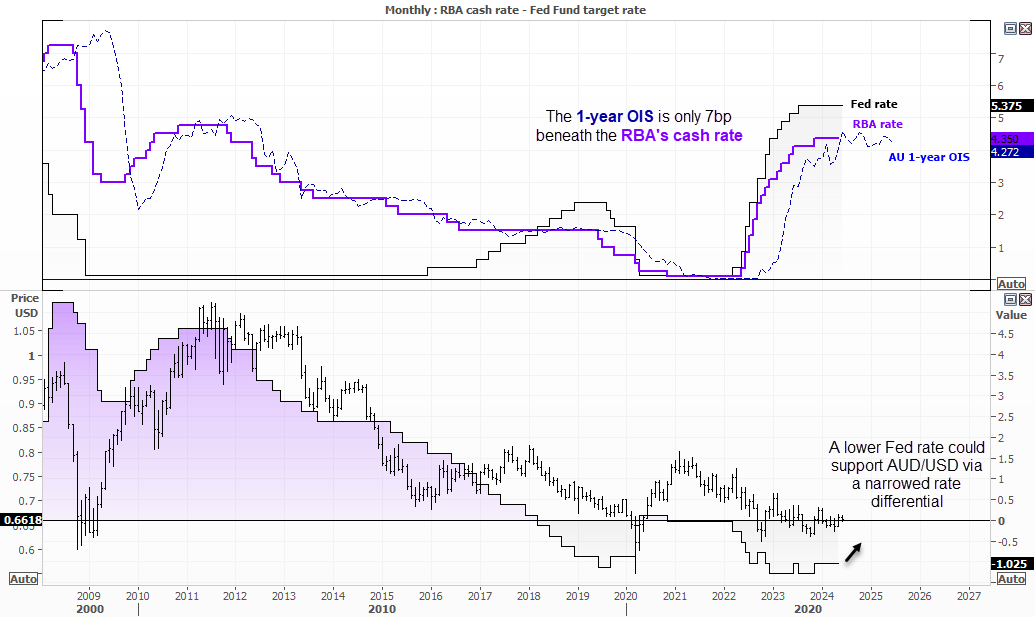
Ultimately, Australia’s rate of inflation needs to soften alongside a weaker jobs market before the RBA can even contemplate discussing interest rate cuts. As they’re simply not there yet, the RBA’s 4.35% cash rate is likely to remain well into 2025.
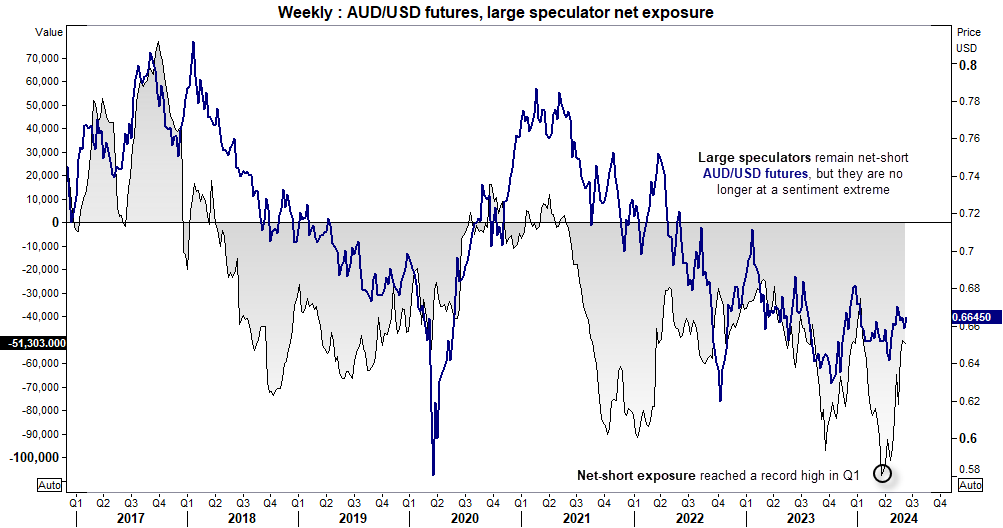
Futures traders significantly reduced net-short exposure to AUD/USD in Q2
While large speculators remain heavily net-short AUD/USD futures, they have significantly reduced their bearish exposure since reaching a record high in late Q1. The reduction has been almost entirely fuelled by a decrease in gross shorts rather than an increase in long bets. Therefore, we cannot confidently say bears won't return in the future. They may well do so if Australian economic data deteriorates, reigniting calls for RBA rate cuts.
However, with economic growth eroding slowly, we doubt Australia is headed for a hard landing. If the Fed can guide inflation lower at a steady rate, they're likely to cut rates sooner and more aggressively than the RBA. This scenario would likely be bullish for AUD/USD.
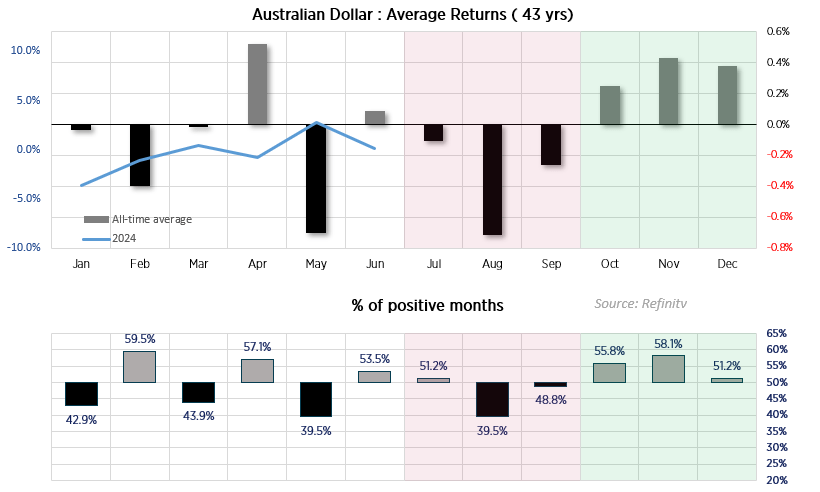
AUD/USD monthly seasonality patterns of the past 43 years:
A distinct pattern has occurred over the past four decades in the second half of the year: Q3 tends to generate negative returns, whereas Q4 tends to generate positive returns.
If we consider that Fed are currently pushing back on multiple rate cuts, this could at least cap upside potential for AUD/USD over the coming quarter. But the case for Fed cuts could build as we enter Q4, which could coincide with more favourable seasonality for the Australian dollar.
- July, August, and September (Q3) have averaged negative returns
- August has stood out as the weakest month, with an average return of -0.7% and a win rate of just 39.5%
- Put differently, AUD/USD has closed lower 60.5% of the time over the past 43 years
- Q4 has generated positive average returns in all three months, alongside win rates above 50%.
- November has both the strongest win rate of 58.1% in Q4, alongside the best average return of 0.43%.
Of course, these statistics are not a roadmap to the future and simply look at the average performance of the past. Past performance is not indicative of future results.
AUD/USD technical analysis:
Volatility, or lack of it, has kept AUD/USD mostly confined within 64c – 69c over the past two years. The current quarter has a high-to-low range of just 5.5%, its narrowest in three years. Whilst this may be a blessing for anyone with overseas exposure, low volatility is not what traders like to see. And with the RBA and Fed unlikely to be cutting rates from elevated levels soon, we could be in for another range-bound quarter. And if Q3 seasonality plays out, a pullback could be near unless US economic data weakens to revive bets of Fed cuts, weigh on the US dollar and support AUD/USD.
Regardless, we suspect traders are more likely to views any retracements low in H2 as a buying opportunity. Besides, the V-bottom which formed in 2020 is assumed to be a significant cycle low, and the price action since the 2021 high appears to be corrective. And this suggests the rally from the 2020 low could resume in the months or years ahead.
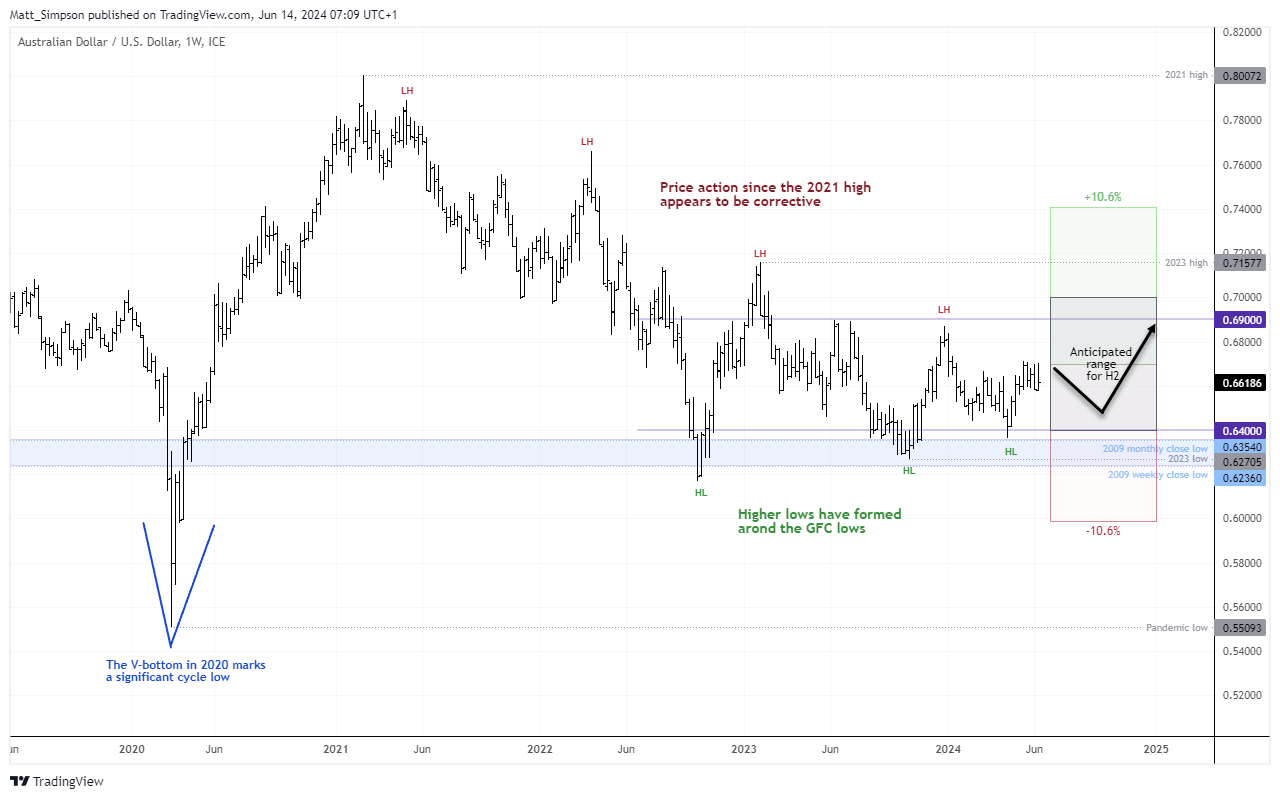
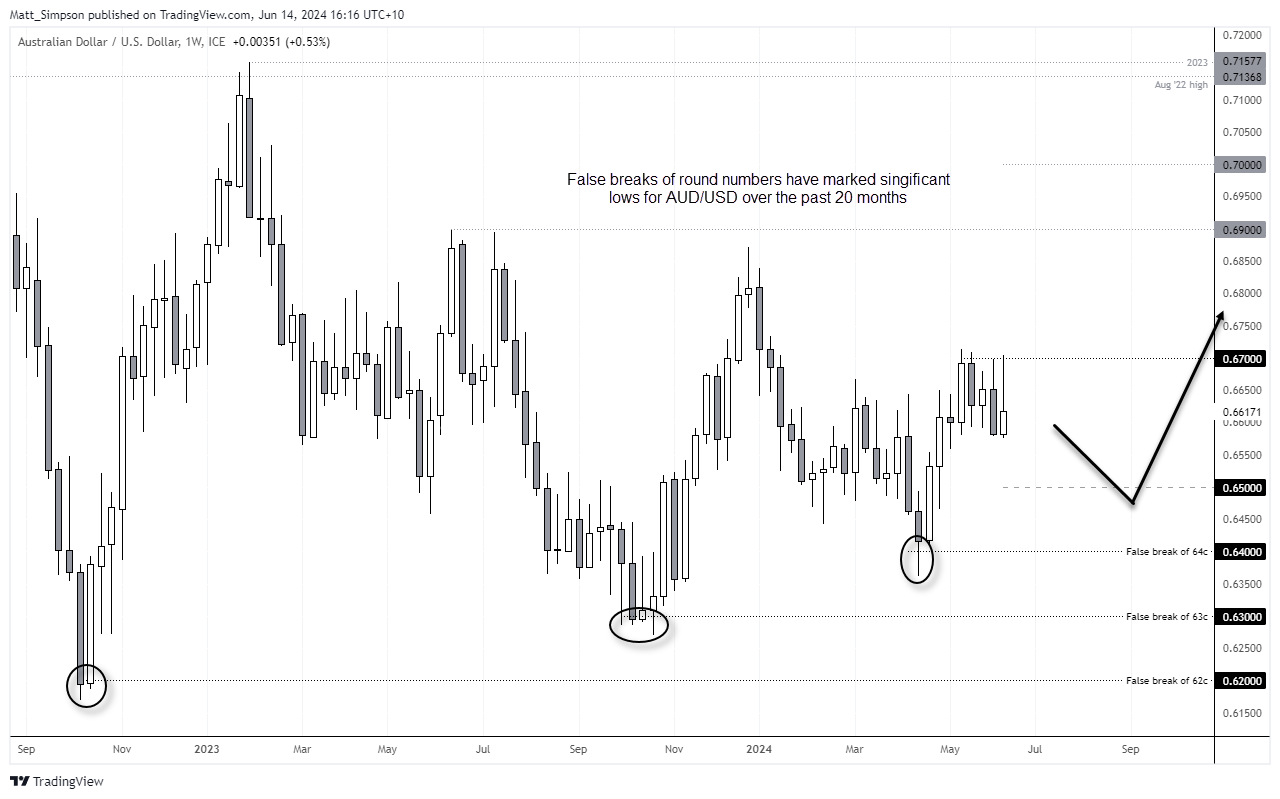
The 4-year average of 6-month high-to-low ranges on AUD/USD is 10.6%. Assuming it holds above 64c, this pencils in a range of 64c – 70c in the second half of this year. Also note on the final weekly chart that higher lows have formed following false breaks of 62c, 63c and 64c over the past 20 months. Could 65c become the next 64 where support is concerned?
- Dips towards the 2009 monthly close low continued to be bought in Q2
- Futures traders significantly reduced net-short exposure to AUD/USD in Q2
- Seasonality could weigh on AUD/USD in Q3 before supporting it into the back of Q4
- The Fed more likely to signal further cuts as we approach Q4, which could weigh on the US dollar, boost appetite for risk alongside AUD/USD
- Volatility could be reawakened in November should Donald Trump win the election, with AUD/USD getting caught in the crossfire of a Wall Street rally and potential trade wars