


At the time of writing, the Nasdaq 100 was sharply off its earlier highs after hitting another record at the US open post-Wednesday’s holiday. European markets closed mostly higher while China closed lower overnight. With tech stocks coming under pressure, the question arises whether other sectors can take up the slack if technology starts heading lower or if this marks a major top for the market. Despite today’s weakness, dip-buying in tech-heavy indices continues to make more sense than trying to pick the top from a trading perspective. However, it's crucial to note that the market needs to weaken before it can reverse. Therefore, bears should not worry about missing “the top” as they will have ample opportunities to sell into rallies at resistance when the market eventually tops out. For now, the Nasdaq 100 forecast remains bullish until the charts suggest otherwise.
Nasdaq 100 forecast video and technical insights on metals and FX markets
Nasdaq 100 Forecast: Index Breaks the 20K Barrier Before Dropping
Today, the Nasdaq 100 reached a new milestone, climbing above 20K for the first time ever before retreating.
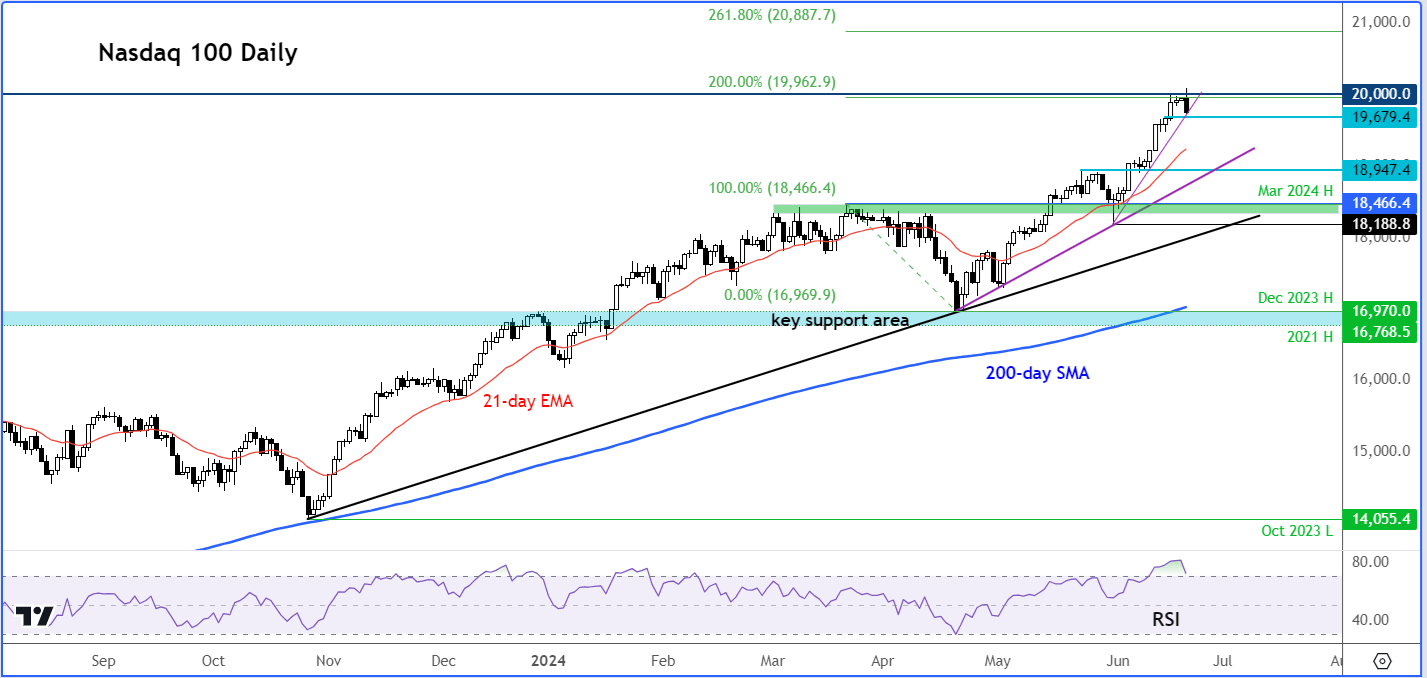
Source: TradingView.com
Since the end of May, the Nasdaq 100 has rallied around 10% from its lowest point of 18,188 to its most recent high. This sharp rally has pushed the index into extreme overbought levels. The relative strength index (RSI) has climbed well above the 70.0 threshold to reach north of 80.0, making it increasingly uncomfortable for traders to justify continued buying into mini intraday dips.
The RSI needs to work off its overbought conditions through either consolidation (time) or a mini sell-off (price action). For this bullish trend to remain intact, significant technical damage should be avoided. A minor pullback would be a welcome sign from a bullish perspective as it would remove some froth from the market.
With the Nasdaq consistently breaking all-time highs, there are no obvious reference points to target on the upside should it surpass the 20K barrier. Here, Fibonacci extensions and measured move objectives become useful. The Nasdaq has now reached the 200% extension of the last downswing that occurred between March and April at 19,962. The 261.8% Fibonacci extension of the same swing is much higher at 20,887.
Key Support Levels to Watch
The first line of defence for the bulls is at 19,680, which was the high from Friday and aligns with a short-term bullish trend line. Below that, 18,950 is the next level, with a more significant support zone around 18,465, corresponding to the high from May.
While bulls would welcome a minor pullback, a full-on sell-off that breaches the recent low of 18,188 would be a bearish development, indicating the creation of a lower low. However, we will address this scenario if it occurs. For now, buying the dip (BTD) near short-term supports remains the dominant strategy.
Bullish Trend Until Charts Indicate Otherwise
It’s essential to consider how much of the current market hype is already priced in. Some argue that the markets are overpricing A.I. optimism. For now, buying the dip at or near short-term supports remains the primary approach. Traders should aim to capitalize on this trend as much as possible but must employ sound risk management strategies given the deteriorating macro picture and overstretched valuations.
When the tide eventually turns, bearish strategies will make sense. Picking the top can be costly, especially when the trend is strong. The trend needs to weaken before reversing, adding a time element to consider.

Conclusion
The Nasdaq 100 forecast remains bullish. Traders may wish to continue buying the dip while employing cautious risk management to navigate the market's potential volatility. Keeping an eye on key support levels and RSI conditions will be crucial.
-- Written by Fawad Razaqzada, Market Analyst
Follow Fawad on Twitter @Trader_F_R
How to trade with City Index
You can trade with City Index by following these four easy steps:
-
Open an account, or log in if you’re already a customer
• Open an account in the UK
• Open an account in Australia
• Open an account in Singapore
- Search for the company you want to trade in our award-winning platform
- Choose your position and size, and your stop and limit levels
- Place the trade
Latest market news
Today 08:30 PM
Today 07:15 PM
Today 04:10 PM
Latest Indices articles

Today 12:30 PM


December 19, 2024 10:26 PM

December 19, 2024 02:23 PM