


The Nasdaq 100 and other US index futures rebounded from their earlier lows, following a flattish close the day before, when we saw a few tech names break out to new all-time highs. With investors largely sitting in their hands ahead of Friday’s release of core PCE data, the recent consolidation observed in the major indices and some sectors of the market should not have surprised anyone too much. But let’s see if that trend changes once Wall Street gets underway and we will see whether the tech sector once again comes to the rescue. Judging by the bullish price action on stocks such as Amazon (AMZN), Alphabet (GOOG). Nvidia (NVDA) and Tesla (TSLA), I wouldn’t bet against another tech-fuelled rally. Among these, the key stock that needs to hold up is Nvidia given how much of an influence it has on the Nasdaq 100. So, let’s have a quick look at the charts of these 4 stocks, but start with the Nasdaq 100 analysis from a technical point of view.
Nasdaq 100 analysis: Technical overview and key levels
The Nasdaq 100 has been consistently breaking all-time highs, with no obvious reference points for further gains if it surpasses the 20K mark. In this context, Fibonacci extensions and measured move objectives become essential tools. The Nasdaq has already reached the 200% extension of the March-April downswing at 19,962. The 261.8% Fibonacci extension of the same swing is significantly higher at 20,887, serving as a potential bullish objective.
In terms of support levels, the immediate hurdles are at 19,650 and 19,470, with a more significant support level around 19,100, where the bullish trend line from April is located.

Source: TradingView.com
So, the Nasdaq 100 chart remains constructive, although the RSI is still near the overbought levels of 70, which may make it uncomfortable for some to chase the rally without a more meaningful pullback than the mini one we have got since last Thursday.
Still, the RSI has now worked off its extreme overbought conditions through time (i.e., consolidation), which would appease the bulls somewhat. They would argue that in such strong bullish trends, you obviously don't want to see too much technical damage and naturally the RSI will have to be in or around the overbought levels to reflect the underlying bullish price action. So, the small pullback we have seen is a welcome sign from a bullish point of view, as this will have removed some froth from the market.
Nasdaq 100 analysis: AMZN, GOOG, NVDA and TSLA could keep tech rally going
Among the big tech stocks to watch are Amazon, Alphabet, Tesla and, obviously, Nvidia. At least three of these charts have displayed bullish characteristics this week, which, if sustained, could help keep the Nasdaq 100 analysis bullish and the tech rally supported.
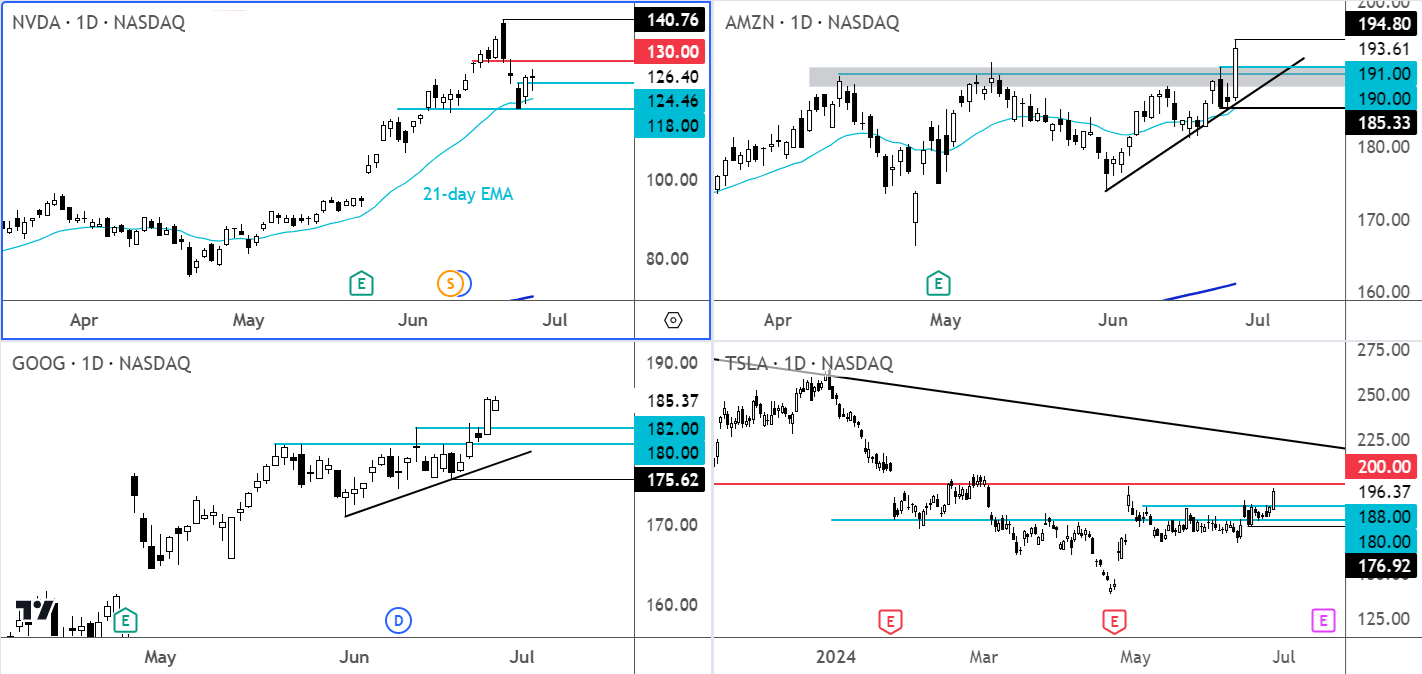
Amazon breaks out after bullish consolidation
Amazon surged through resistance in the $190 - $191 area on Wednesday to close up 3.9% at a record high. In doing so, it became the 5th member of the "Magnificent 7" group of stocks to cross the $2T mark in market capitalization. The breakout is clearly a bullish development, one that could help keep the tech rally sustained when leaders like Nvidia take a breather. The $190-$191 area is now a key support zone to watch on any short-term weakness. This area must hold to keep the bulls happy. The line in the sand is at $185.33, Monday’s low. If that level breaks then this would invalidate the bullish price action we have seen this week, making it a false breakout. In that case, a full-on sell-off could ensue. Otherwise, with the stock trading at record highs, it could go on to rise to $195 initially ahead of $200 thereafter.
Alphabet hits another ATH
Alphabet has been breaking out to fresh all-time highs quite consistently. This week, it came out of a bullish consolidation pattern, breaking above $180.00 resistance in the process. It has subsequently taken out the most recent high around $182.00. This level is now going to be an important support level to watch. Ideally, you don’t want to see the stock go back below the breakout area, but if it does, this wouldn’t necessarily cause too much of a problem unless it goes on to break below the most recent low that was formed prior to the breakout around the $175.62 area.
Tesla stock continues road to recovery
Tesla’s long-term chart has a clear bearish trend line in place going back to November 2021, with several lower highs since. However, the short-term price action since the last couple of weeks of April has been bullish on Tesla. The stock surged above former resistance at $180.00 and has been oscillating around that psychological level for several weeks. This week, however, Tesla has decided to push higher, breaking above another short-term resistance area of $188. This level is now the most important short-term support to watch on any potential weakness. On the upside, $200 marks the next potential hurdle where the stock had previously struggled around. Above $200, there is not much further obvious resistance levels to watch until the bearish trend line, which could come in around $220 depending on how fast price gets there, if it does at all. The recent low at $176.92 is now the line in the sand for me. If it were to break below that low, this would nullify this week’s bullish price action and potentially scare away the bulls.
Nvidia shows signs of stabilisation after recent wobble
Nvidia, which is the most important stock for the tech sector, has been quite volatile in the last several days, after selling-off from the record high of $140.76 it achieved last Thursday. For now, it looks like Nvidia has found support around the $118.00 level, with the stock holding above the 21-day exponential moving average. Monday’s high of $124.46 has been broken, and this level is now important to hold on a daily closing basis to keep the bullish momentum alive. The line in the sand is at $118.00 for me. In terms of resistance, $130.00 is now the most obvious resistance to watch, having severed as support for a few days prior to the break down last week.
In short…
The Nasdaq 100 analysis remain bullish given its relentless climb to new all-time highs, which highlights the importance of advanced technical analysis tools like Fibonacci extensions for setting targets. Stocks like Amazon, Alphabet, Tesla, and Nvidia are crucial in sustaining the tech rally, each demonstrating significant bullish potential. Keeping an eye on key support and resistance levels will be vital for traders navigating what has been a very strong bullish trend.
-- Written by Fawad Razaqzada, Market Analyst
Follow Fawad on Twitter @Trader_F_R
How to trade with City Index
You can trade with City Index by following these four easy steps:
-
Open an account, or log in if you’re already a customer
• Open an account in the UK
• Open an account in Australia
• Open an account in Singapore
- Search for the company you want to trade in our award-winning platform
- Choose your position and size, and your stop and limit levels
- Place the trade
Latest market news
Today 08:30 PM
Today 07:15 PM
Today 04:10 PM
Latest US Tech 100 articles

October 10, 2024 05:00 PM
September 29, 2024 08:00 AM

September 11, 2024 05:00 PM
July 31, 2024 04:26 PM