


The Australian dollar continued to rise Across the board on Wednesday, following the hawkish RBA meeting. AUD/JPY broke above 105 and now sits at an 11-year high. AUD/NZD made no attempt at a pullback around resistance around 1.0850 before reaching a 4-week high. Political instability in France continued to weigh on the euro and send EUR/AUD to a 1-year low.
USD/JPY rose for a fifth day yet once again failed to close above 158, which keeps my bias for a retracement lower towards 157.30 alive. The US dollar index was flat during a low-volatility session due to the US public holiday which kept most FX majors confined to tight ranges.
WTI crude oil extended its rally from the June low to 9%, although the small Doji during the half-day of trade due to the US public holiday saw it pause around $81. It is one of many markets with indecision candles, which need to factor in low volumes – which means they’re not necessarily reversal candles.
The Bank of Canada’s minutes revealed that the central bank considered holding their cash rate until July instead of the 25bp cut they ran with earlier this month. And that further underscores the low probability of another cut arriving soon.
UK inflation fell to the BOE’s 2% target for the first time in nearly three years. PM Rushi Sunak was quick to take credit and urge voters not to put that inflation at risk by voting for labour at the upcoming election. Core CPI slowed to 0.5% (0.9% prior) and met the 3.5% y/y estimate, down from 3.9%. Producer prices were also flat.
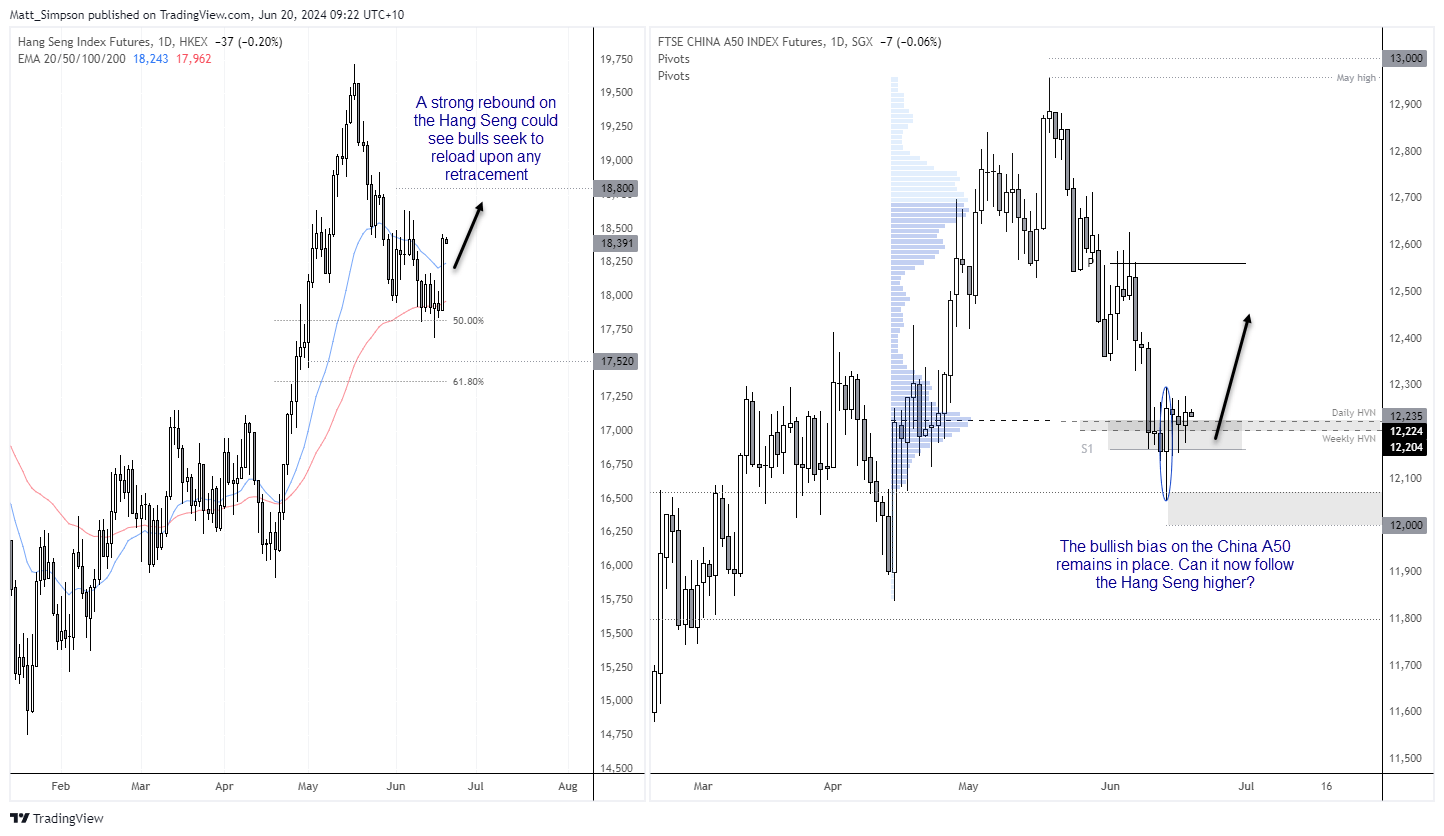
The Hang Seng enjoyed its best day in three months, rising nearly 3% on news of financial reforms. Support was found at the 50% retracement level and 50-day EMA before the elongated bullish engulfing candle formed. With the potential for a bullish follow-through on the radar, bulls might seek to reload upon a retracement towards the 20-day EMA.
We’re yet to see the China A50 move higher in line with my bullish bias outlined on Tuesday, but I remain hopeful whilst prices remain above last week’s bullish engulfing-day low. As a reminder, there’s some decent support above 12k for the China A50 so perhaps it will now try and close the gap with the Hang Seng.

Economic events (times in AEST)
- 11:15 – PBoC 1, 5-year prime loan rate
- 11:30 – RBA reserve assets
- 12:30 – Singapore unemployment
- 17:30 – SNB monetary policy decision
- 18:30 – SNB press conference
- 21:00 – BOE interest rate decision
- 22:30 – US jobless claims
ASX 200 at a glance
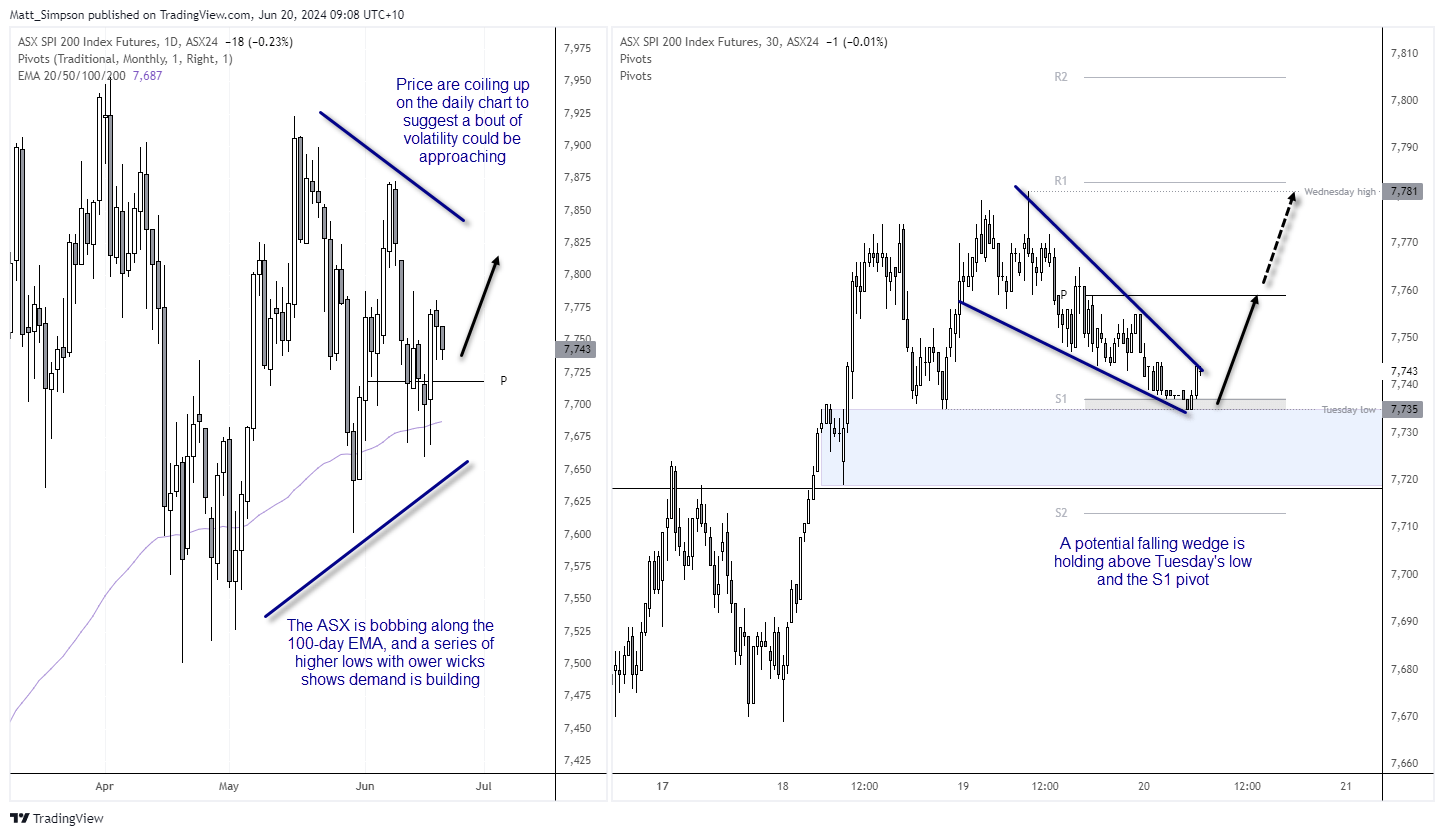
- The ASX 200 cash index formed a small doji on Wednesday, and stocks that advanced and declined were roughly balanced to underscore a day of indecision
- Yet Tuesday’s bullish engulfing candle suggests the next move could be higher for the local index
- SPI 200 futures were lower overnight during quiet trade, but that could work out favourable for bulls (even if volatility might be lower today unless we’re treated to a market0dricing catalyst)
ASX 200 futures technical analysis:
The daily chart shows that SPI 200 were lower for a second session, and that highs and lowers are converging to show volatility is compressing. As we know volatility is bipolar, it will have to rise at some point. And as the ASX is holding nicely above the 100-day EMA with higher lows and lower wicks, the bias is for an eventual upside break. The odds of a decent rally today may be slim with the US public holiday on Wednesday, but there may be an opportunity for a near-term upswing.
The 30-minute chart shows prices have gradually drifted towards Tuesday’s low and the daily S1 pivot. The bias now is to seek dips towards the S1 level to hopefully catch a swing towards the pivot point (7760). Also note the potential falling wedge that projects a bullish target around the base at 7780, just below the R1 pivot.
View the full economic calendar
-- Written by Matt Simpson
Follow Matt on Twitter @cLeverEdge
How to trade with City Index
You can trade with City Index by following these four easy steps:
-
Open an account, or log in if you’re already a customer
• Open an account in the UK
• Open an account in Australia
• Open an account in Singapore
- Search for the market you want to trade in our award-winning platform
- Choose your position and size, and your stop and limit levels
- Place the trade
Latest market news
Today 08:30 PM
Today 07:15 PM
Today 04:10 PM
Latest Asian Open articles

December 19, 2024 10:26 PM

December 18, 2024 10:16 PM

December 17, 2024 10:06 PM
December 16, 2024 09:52 PM