


Video: Gold and silver forecast
Gold and silver have been little changed in the week so far. The US dollar has rebounded after Monday’s technically-driven weakness that came on the back of a 3-week rally in the Dollar Index. This dollar strength has been one of the reasons behind the metal’s struggles to push higher. The greenback has become investors’ preferred FX hedge against political uncertainty in Europe. Ahead of the first round of the French parliamentary election on June 30, investors are holding back on a number of risk assets. So, the political uncertainty has had some indirect influence on gold prices. The full impact of Marine Le Pen's party is likely to become clearer after the run-offs on July 7. In the US, important data releases include May's core PCE inflation figures on Friday, the June non-farm jobs report on July 5, and the CPI report on July 11. These are some of the additional risk factors keeping a lid on gold (XAUUSD) and silver (XAGUSD) prices. Still, both of our gold and silver forecast remains bullish. Their ongoing consolidation phase should not be mistaken for a sign of weakness.

Gold forecast: XAUUSD weekly chart technical analysis
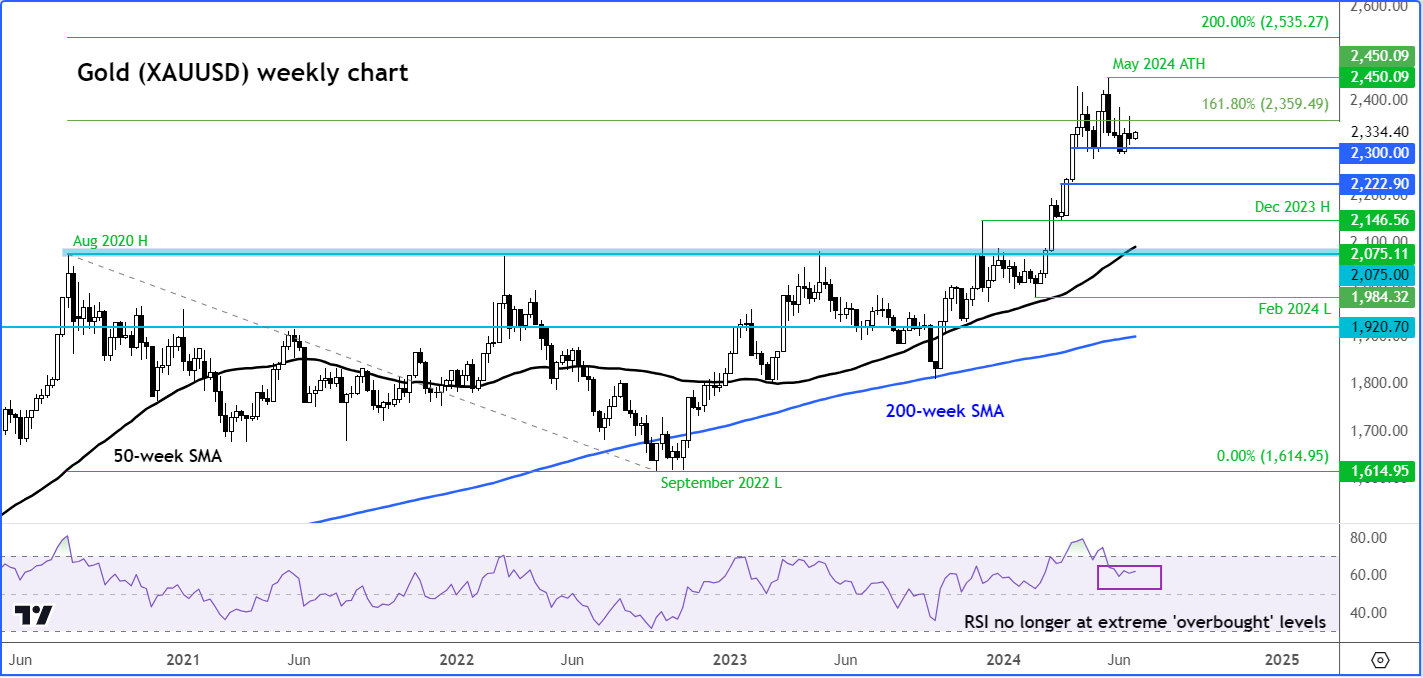
Gold’s consolidation since the start of April has allowed the Relative Strength Index (RSI) to work off its ‘overbought’ conditions mainly through time, than price action, which is always a bullish sign. But even if gold were to weaken further from here, there are numerous support levels that could provide a floor on the way down. The bears will have to exert significant pressure to turn the tide meaningfully in their favour.
Indeed, the precious metal has formed several higher lows and higher highs in the past several months, and this sequence has to end before we put on hold our bullish view from a tactical point of view. Any bearish price action we see in the interim should be taken with a pinch of salt, in light of this year’s significantly bullish price action.
Among the key levels of potential support to watch, $2222 is the first line of defence for the bulls, should gold break below $2300 support decisively. Below that level, $2146, which corresponds with the December 2023 high, is also an interesting level to watch.
XAUUSD forecast: Gold technical analysis on daily chart
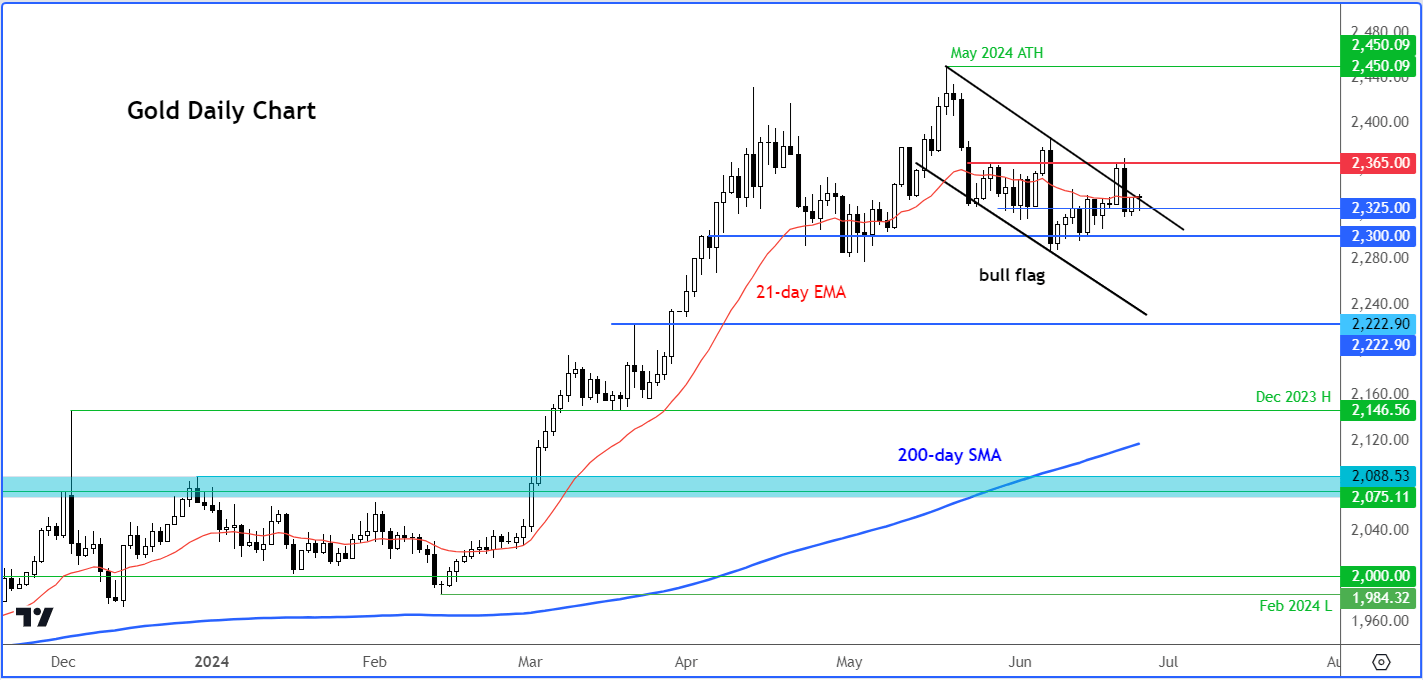
On the daily time frame, gold is holding inside a bull flag pattern. The bulls have pushed gold above short-term resistance at $2325, but now are aiming to break the resistance trend of the bull flag more decisively. The next level of potential resistance comes in around the $2365 area. If we see a move above this level, then that would provide the clearest signal yet that the bull trend has resumed. The $2300 support level has held despite several attempts to break below it. Therefore, a daily close below $2300, if seen, would turn the short-term XAUUSD forecast somewhat bearish, potentially leading to selling toward the next support level at $2222.
Gold and silver forecast: XAGUSD technical analysis
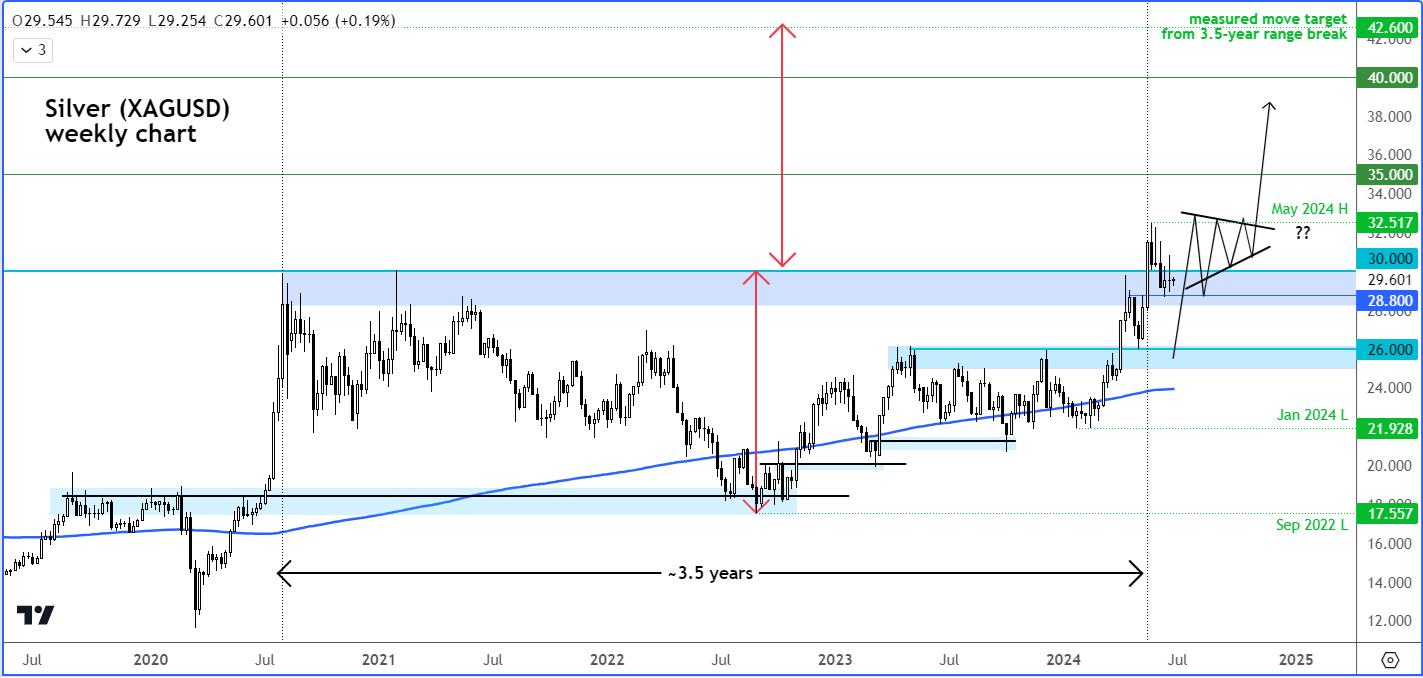
Silver’s weekly chart continues to point to bullish consolidation just below the $30 level, where it had struggled in the last several years. This year, it finally breached this zone, if only for a couple of weeks, before falling back on profit-taking amid demand concerns over. Still, XAGUSD has lots of ground to make up on XAUUSD if it wants to narrow the gold-silver ratio to near the historical average.
Silver forecast: XAGUSD daily chart
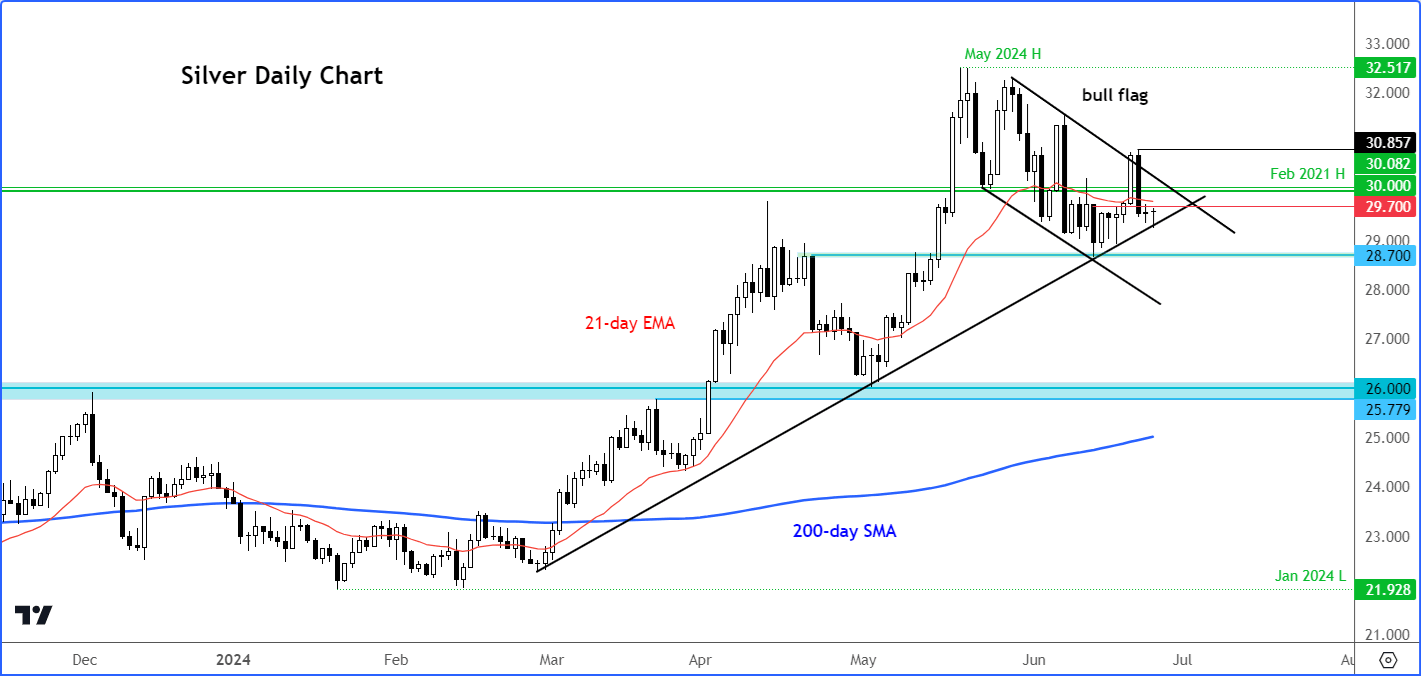
On the daily time frame, one can see that gold is also residing inside what looks to be a bullish continuation pattern, namely a bull flag. Patience is thus needed until the chart suggests it is ready to start a new bull trend again. A potential rise back above $30, which is also where the resistance trend of the bull flag comes in, is what could trigger the next phase of technical buying pressure.
Short-term resistance ahead of $30.00 is seen around $29.70. In terms of support, $28.70 is key, which is a level that held on the first test a couple of weeks ago.
Summary
In summary, I remain optimistic about gold and silver in the upcoming months, anticipating new record highs above $2450 for XAUUSD, particularly if the Fed implements multiple rate cuts this year due to a sharper-than-expected decline in inflation. As for XAGUSD, it could surge to $35 following its significant breakout earlier this year. So, my gold and silver forecast remains bullish despite recent struggles.
Source for all charts used in this article: TradingView.com
-- Written by Fawad Razaqzada, Market Analyst
Follow Fawad on Twitter @Trader_F_R
How to trade with City Index
You can trade with City Index by following these four easy steps:
-
Open an account, or log in if you’re already a customer
• Open an account in the UK
• Open an account in Australia
• Open an account in Singapore
- Search for the company you want to trade in our award-winning platform
- Choose your position and size, and your stop and limit levels
- Place the trade
Latest market news
Yesterday 11:04 PM
Yesterday 04:36 PM
Yesterday 04:30 PM
Yesterday 01:12 PM
Yesterday 12:00 PM
Latest Gold articles

Yesterday 04:30 PM

June 28, 2024 12:00 PM

June 27, 2024 12:30 PM

June 26, 2024 07:30 PM