Asian Indices:
- Australia's ASX 200 index fell by -68.7 points (-0.97%) and currently trades at 7,045.80
- Japan's Nikkei 225 index has fallen by -160.83 points (-0.56%) and currently trades at 28,769.50
- Hong Kong's Hang Seng index has risen by 39.49 points (0.2%) and currently trades at 19,812.52
- China's A50 Index has risen by 120.08 points (0.88%) and currently trades at 13,730.36
UK and Europe:
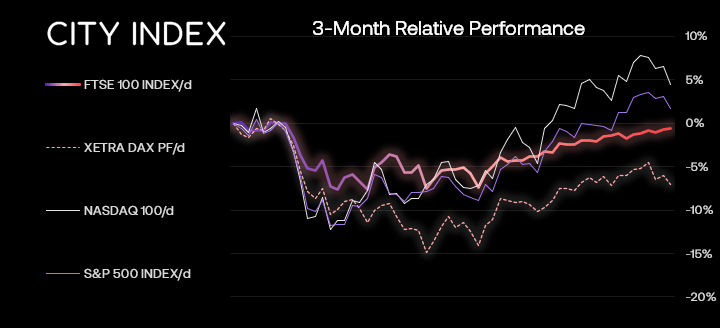
- UK's FTSE 100 futures are currently down -6.5 points (-0.09%), the cash market is currently estimated to open at 7,543.87
- Euro STOXX 50 futures are currently down -7 points (-0.19%), the cash market is currently estimated to open at 3,723.32
- Germany's DAX futures are currently down -23 points (-0.17%), the cash market is currently estimated to open at 13,521.52
US Futures:
- DJI futures are currently down -145 points (-0.43%)
- S&P 500 futures are currently down -72 points (-0.54%)
- Nasdaq 100 futures are currently down -19 points (-0.45%)

Equity markets were mixed overnight, with the ASX 200 falling around -0.8% and dragged lower by commodity stocks, and the Nikkei was down around -0.3%. Yet China’s equity markets posted minor gains following further easing from the PBOC (People’s Bank of China).
The PBOC cut lending rates again to help support the property sector. The 5-year LPR (Loan Prime Rate) was cut by -15bp to 4.3%, and the 1-year was cut -5bp to 3.65%. USD/CNH rose to a 23-month high but has since dipped back beneath Friday’s high.
The US dollar remains supported following hawkish comments from another Fed official on Friday, with Thomas Barkin saying the “urge” for central bankers was towards faster rate increases. However, AUD and NZD were the strongest majors following the PBOC’s latest round of easing. The yen was the weakest currency overnight, allowing USD/JPY to trade higher for a fifth consecutive session and test the July 27th high.
EUR/CHF daily chart:

A strong bearish trend has developed on the daily chart of EUR/CHF. Retracements have been timely and the trend has remained beneath the 20-day eMA since prices broke through trend support in June. The break below 0.9700 ha now respected this previous support level as resistance, and prices are considering a break to new lows. A break beneath 0.9600 (and the monthly S1 pivot) assumes bearish continuation and brings the 0.9500 support zone into focus for bears. Bears could also consider fading into minor retracements whist prices remain beneath 0.9700, in anticipation of an eventual break lower.
FTSE 350 – Market Internals:

FTSE 350: 4193.31 (0.11%) 19 August 2022
- 70 (20.00%) stocks advanced and 264 (75.43%) declined
- 7 stocks rose to a new 52-week high, 9 fell to new lows
- 34.57% of stocks closed above their 200-day average
- 100% of stocks closed above their 50-day average
- 3.43% of stocks closed above their 20-day average
Outperformers:
- + 2.48% - Bank of Georgia Group PLC (BGEO.L)
- + 2.46% - Reckitt Benckiser Group PLC (RKT.L)
- + 2.14% - AstraZeneca PLC (AZN.L)
Underperformers:
- -10.19% - Marshalls PLC (MSLH.L)
- -6.48% - Genuit Group PLC (GENG.L)
- -6.29% - Easyjet PLC (EZJ.L)
Economic events up next (Times in BST)

How to trade with City Index
You can easily trade with City Index by using these four easy steps:
-
Open an account, or log in if you’re already a customer
• Open an account in the UK
• Open an account in Australia
• Open an account in Singapore
- Search for the company you want to trade in our award-winning platform
- Choose your position and size, and your stop and limit levels
- Place the trade


