


DJIA, S&P 500, Nasdaq 100 Key Points
- Bad economic news is no longer good news for the stock market as traders worry the Fed is falling behind the curve.
- The Dow Jones Industrial Average (DJIA) has been lagging the S&P 500 and Nasdaq 100, leaving it vulnerable to a deeper drop if stocks roll over.
- The SPX (5,500) and NDX (20,000) are both testing key psychological resistance levels while trading in overbought territory.
Under the surface, we’ve started to see a shift in how stock market indices are reacting to US economic data. After at least a year of “bad (economic) news is good (stock market) news” trade (stemming from the idea that slowing economic data means that the Federal Reserve will be more likely to cut interest rates, supporting stocks and vice versa), we’ve seen the market’s reaction to poor economic data shift in recent weeks.
Take today’s US Retail Sales release for example. The consumer gauge came in below expectations on both a headline (+0.1% m/m) and “core” basis (-0.1% m/m), but US stocks have failed to catch a bid as traders fear the Federal Reserve has fallen behind the curve and risks tipping the US economy into a deeper-than-necessary slowdown or outright recession if it fails to start cutting interest rates soon.

Below, we highlight the technical backdrop and key levels to watch on the Dow Jones Industrial Average, S&P 500, and Nasdaq 100:
Dow Jones Industrial Average Analysis – DJIA Daily Chart
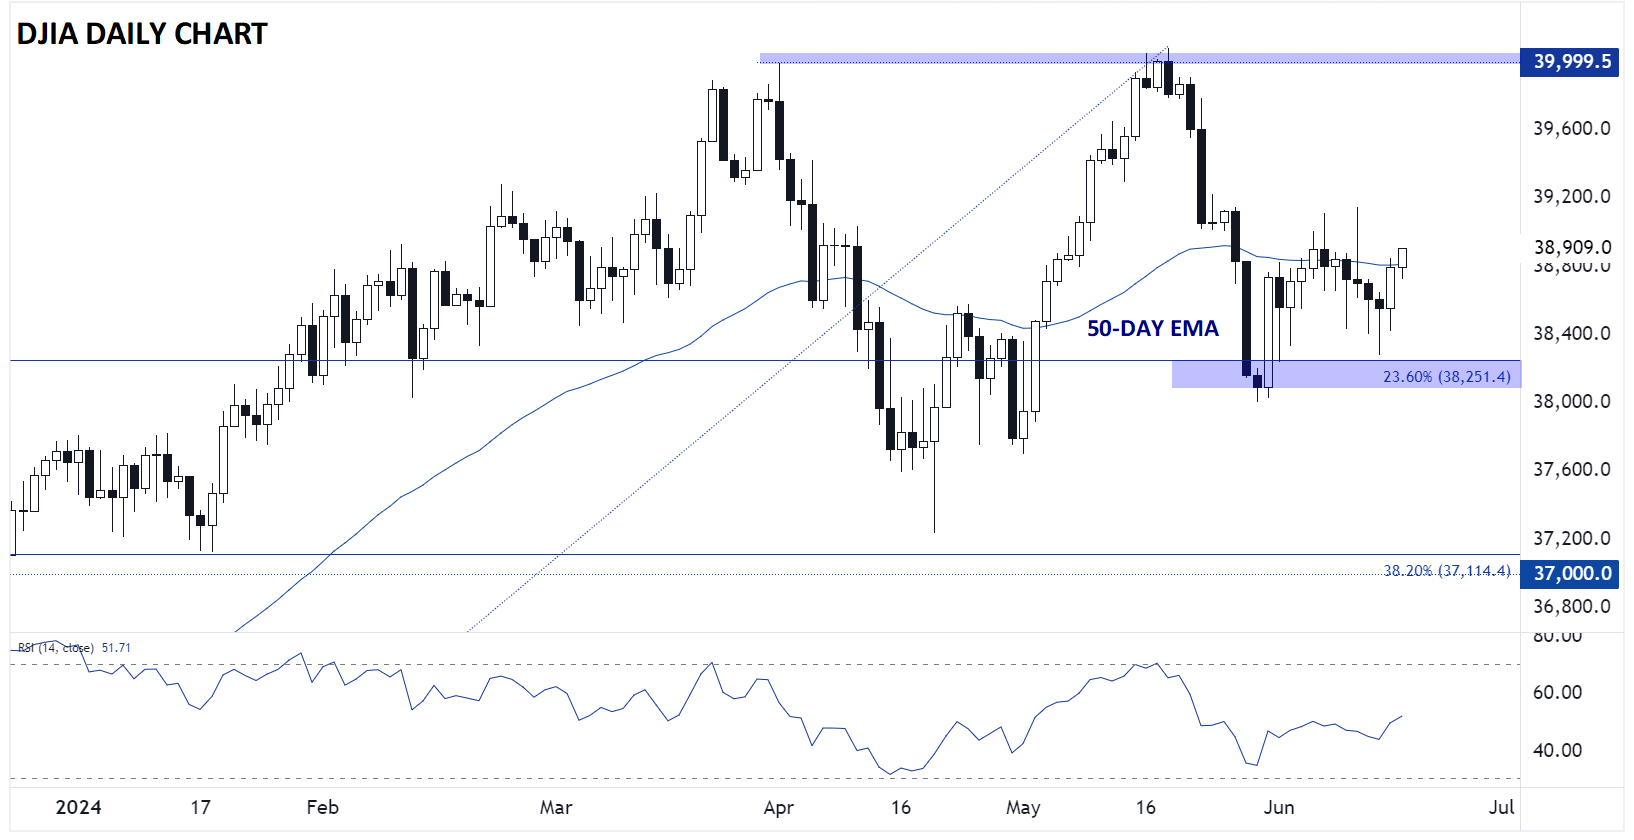
Source: TradingView, StoneX
The Dow remains the weakest of the major US indices, struggling from its relative underallocation to the stocks at the forefront of the indomitable AI trade. As we go to press, the key short-term support level to watch is at 38,250, the 23.6% Fibonacci retracement of the October-May rally. Meanwhile, a break above the June high at 39,150 would hint at a potential recovery rally in the oldest inde, potentially exposing the record highs up around 40K next.
S&P 500 Analysis – SPX Daily Chart
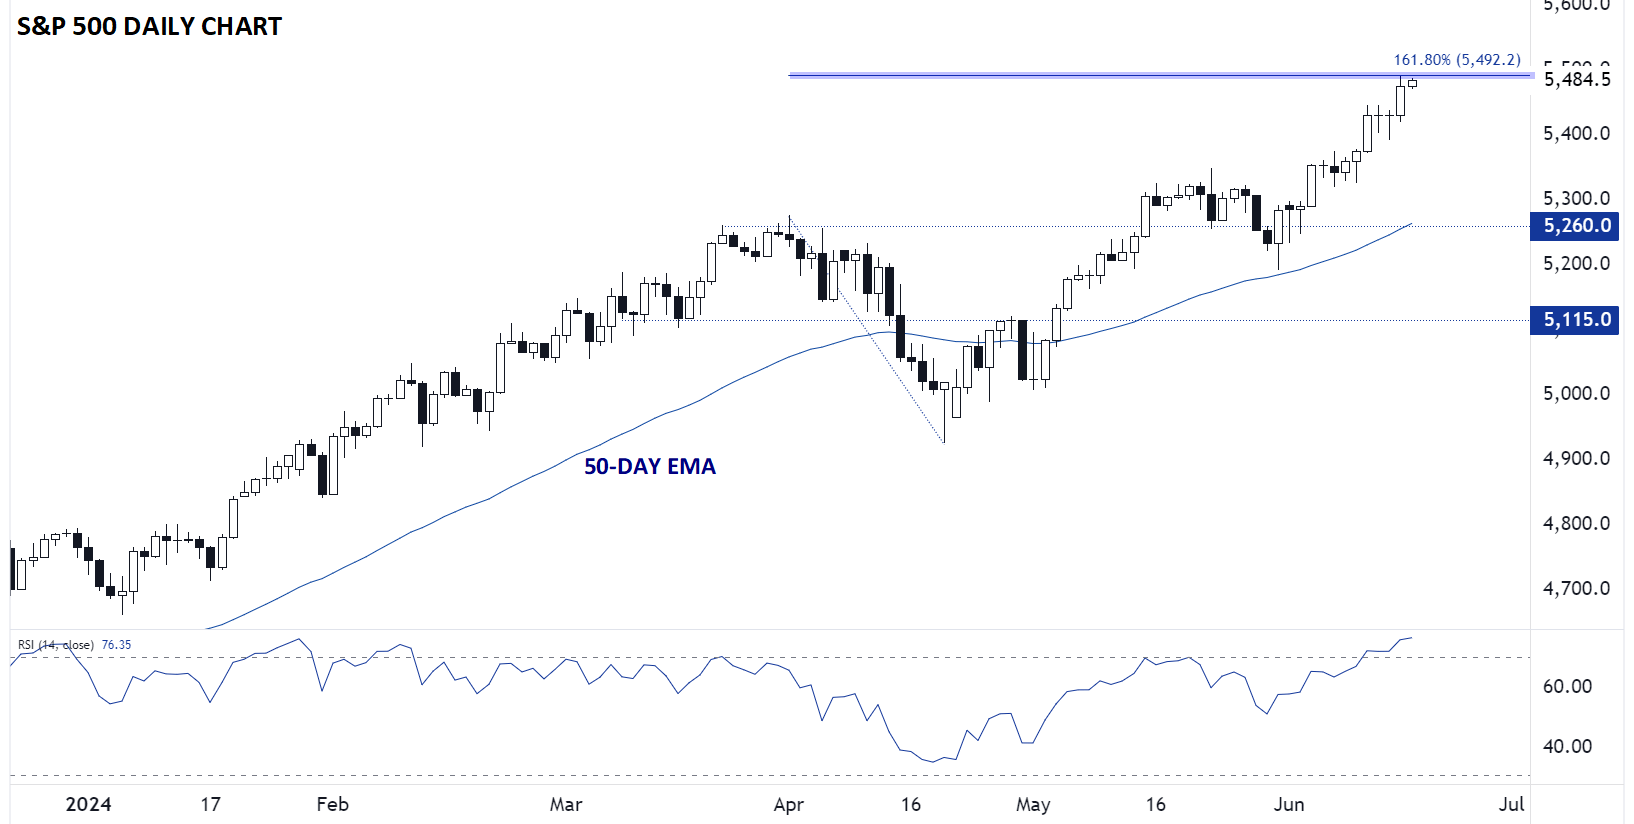
Source: TradingView, StoneX
Relative to Papa Dow, the S&P 500’s uptrend looks incredibly strong, though it is testing a potential resistance level at 5,500. In addition to being a psychologically-significant round number, that area also represents the 161.8% Fibonacci extension of the March-April correction. With the 14-day RSI deep in overbought territory, SPX is vulnerable to a pullback this week if we see continued weakness in US economic data.
Nasdaq 100 Analysis – NDX Daily Chart
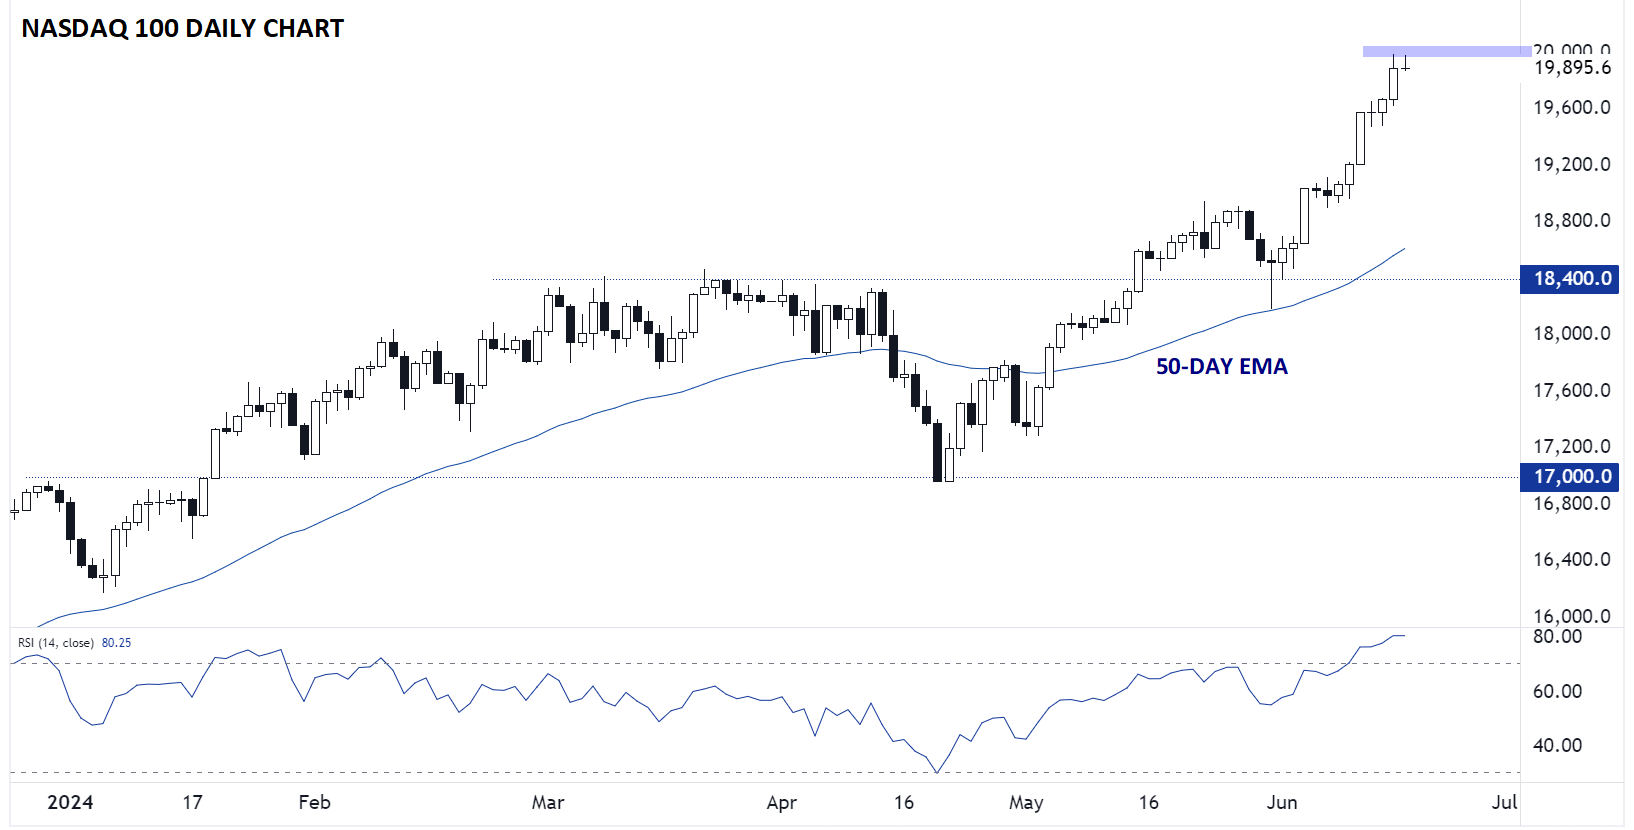
Source: TradingView, StoneX
Last but not least, the Nasdaq 100 is the poster-child for benefitting from the omnipresent AI trade driving tech stocks higher. The index is now approaching a key round number of its own at $20K, potentially setting the stage for a pullback (or at least a pause) given the overbought RSI indicator. That said, the technical uptrend remains broadly healthy, and trader are likely to step in buy any dips back to the low-19,000s unless/until the fundamental backdrop deteriorates dramatically.
-- Written by Matt Weller, Global Head of Research
Check out Matt’s Daily Market Update videos on YouTube and be sure to follow Matt on Twitter: @MWellerFX
Latest market news
Today 04:39 AM
Yesterday 10:32 PM
Yesterday 08:25 PM
Yesterday 07:24 PM
Latest US SP 500 articles

January 24, 2025 05:38 PM

January 16, 2025 06:00 PM

December 12, 2024 02:29 PM

December 3, 2024 04:58 PM