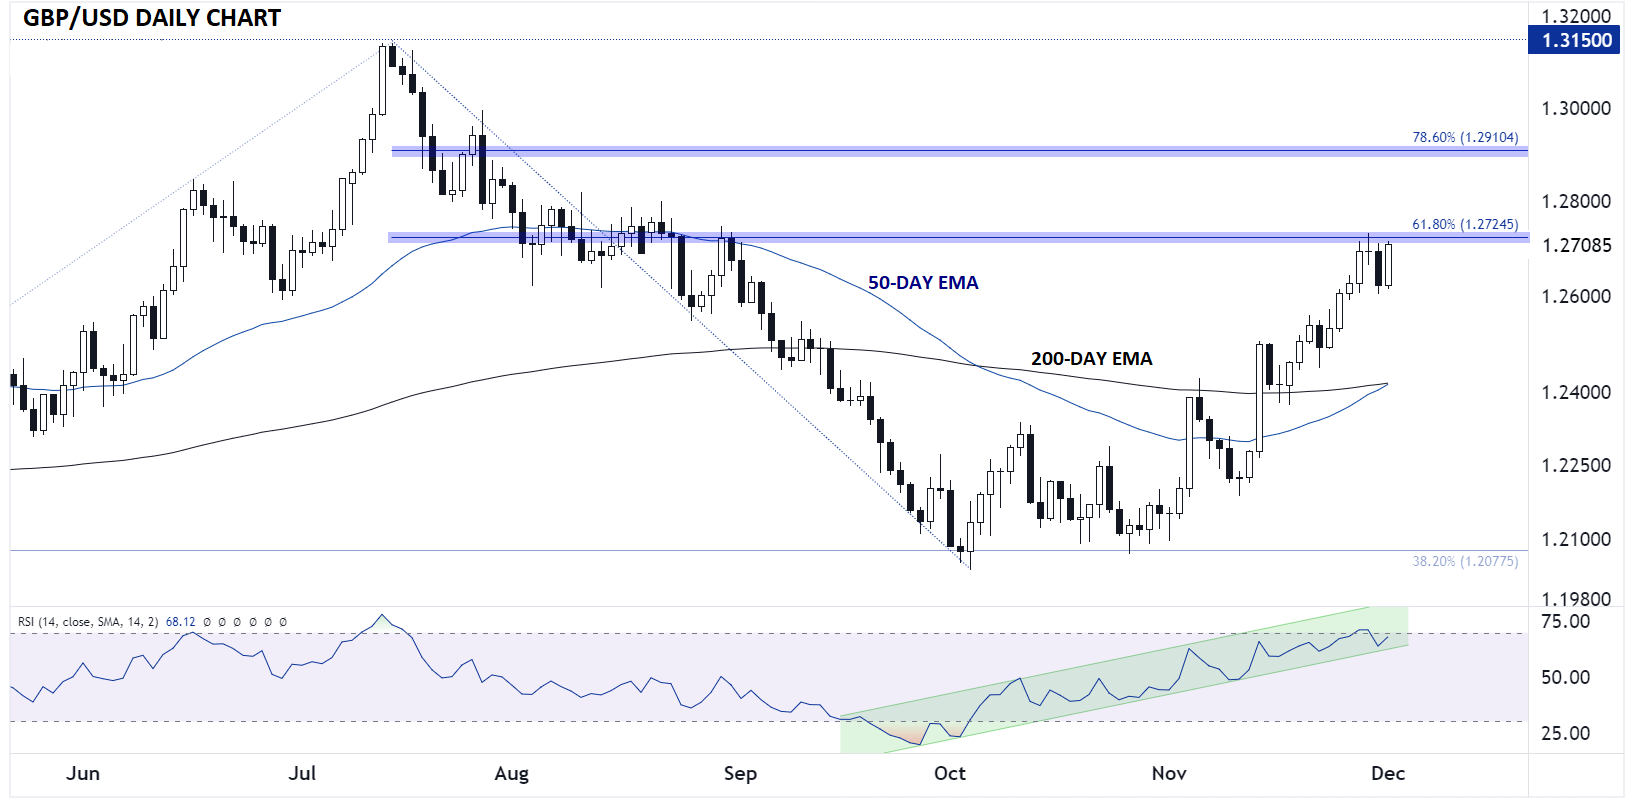
GBP/USD Key Points
- GBP/USD is soaring on expectations of aggressive Fed rate cuts in 2024, despite Fed Chairman Powell’s protestations.
- An imminent “golden cross of the 50-day EMA above the 200-day EMA marks a shift to a bullish longer-term trend.
- The pair is testing resistance near 1.2725, with the next resistance level looming up near 1.2900.
GBP/USD Fundamental Analysis
It’s been a relatively quiet week for UK economic data, but developments on the other side of the Atlantic have more than made up for it. The big turning point was on Tuesday when Federal Reserve Governor Christopher Waller noted that the central bank could start cutting interest rates in “several months” if inflation data continued to moderate. This was the first time a core Fed official formally acknowledged the possibility of rate cuts, let alone setting out a specific, relatively rapid timeline.
In his speeches earlier today, Fed Chairman Powell attempted to walk that back, stating "It would be premature to conclude with confidence that we have achieved a sufficiently restrictive stance, or to speculate on when policy might ease. We are prepared to tighten policy further if it becomes appropriate to do so." However, markets are not buying the token attempt at hawkish talk, with Fed Funds Futures traders now pricing in a 2-in-3 chance of a rate cut in the Fed’s March meeting per CME FedWatch:

Source: CME FedWatch
Looking a bit further out, traders have tacked on a full 50bps of projected 2024 rate cuts this week alone, underscoring the big dovish shift in markets. Not surprisingly, the US Dollar has sold off aggressively this week, losing more than -1% against all of its major rivals outside of the euro.
British Pound Technical Analysis – GBP/USD Daily Chart

Source: TradingView, StoneX
Keying in on GBP/USD, cable is recovering from yesterday’s pullback to retest its 61.8% Fibonacci retracement near 1.2725. At the same time, the 50-day EMA is about to cross back above the 200-day EMA, creating a classic “golden cross,” that marks a shift in the longer-term trend from bearish to bullish.
Looking ahead, bulls will want to see a clean break above 1.2725 to opend the door for a continuation toward the August highs near 1.2800, with the 78.6% Fibonacci retracement of the July-October pullback near 1.2900 marking the next clear level of resistance after that. If we do see a bearish reversal off 1.2725 resistance, the first logical support level to watch will be this week’s low near 1.2600
-- Written by Matt Weller, Global Head of Research
Follow Matt on Twitter: @MWellerFX


