The US economy grew slower than originally estimated and prices remained elevated in the first quarter, according to a revised GDP report. Q1 growth was downwardly revised to 1.3% from 1.6% (3.5% in Q4), consumer spending was lowered to 2% from 2.5% (3.5% previously). Core PCE prices were a touch softer at an elevated level of 3.6%, down from 3.7% (3.7% previously).
Markets looked past the higher prices on the eve of a key PCE inflation report, focussing on the likelihood that weaker growth and consumption could prompt the Fed to cut rates sooner. US yields dragged the US dollar lower which was the weakest FX major on Wednesday, seeing the USD index hand back most of Tuesday’s gains. The 2-year now trades at 4.92 after meeting resistance at 5% on Tuesday.

Gold recovered back above Friday’s low after falling to a 3-week low ahead of the European open. Copper prices remain near its daily low after reaching a 3-week low of its own. The Bloomberg commodity index tracked Wall Street indices lower for a second day on demand concerns. Crude oil also down for a second day on oversupply concerns, with the 1-day Brent timespread moving into contango for the first time since January. Traders shrugged off lower stockpiles, and WTI reversed Tuesday's gains made on reports that OPEC+ planned to extend their oil production cut at Sunday's meeting.
Nikkei 225 technical analysis:
Earlier this week I outlined a bearish scenario for the Nikkei 225, based on price action on market positioning of asset managers from the commitment of trader report (COT report). I’ll admit that momentum turned lower than I expected. In fact it was within hours of the article being publish, so a bit of luck was on my side this week. You can view the article below.
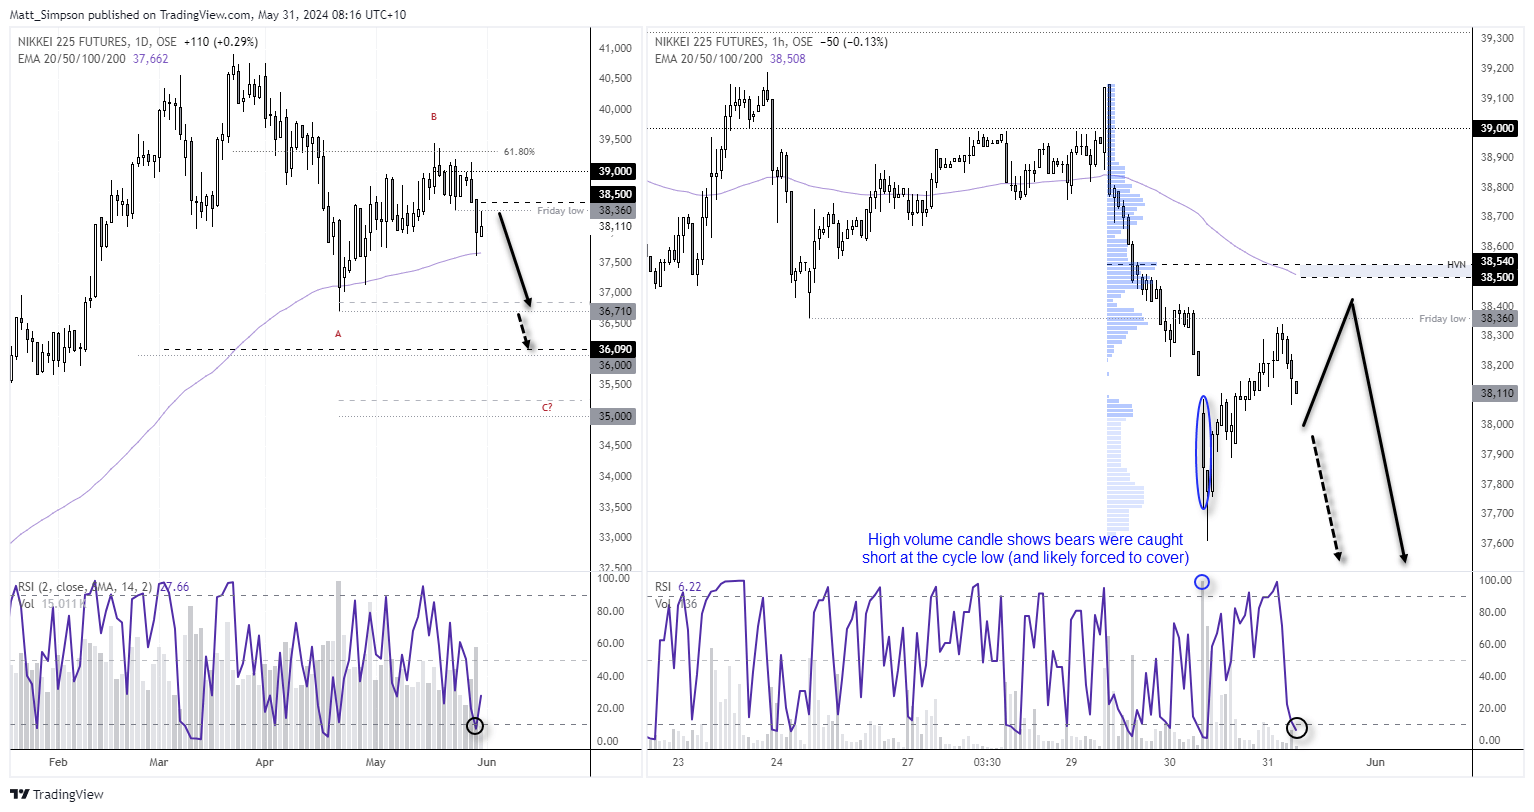
The daily chart shows a clean break out of the correction pattern (wave B), which suggest a move at least to the cycle lows around 37k. Although wave equality projects a downside target around 35k. However, the daily RSI (2) reached oversold on Thursday and support was found at the 100-day EMA. The market is now trying to carve out an inside day, although so far respecting the 38,360 low as resistance. Ultimately, the core bias remains for a move to at least 37k and to fade into rallies below 38,500.
The 1-hour chart also shows RSI (2) reached oversold, so perhaps bears will be treated to another leg higher before momentum rolls over once more. Notice the high-volume node at 38,450 and the 100-bar EMA, which could provide resistance should prices break above Friday’s low.
Related analysis:
The Nikkei 225 has been added to my watch (out below) list

ASX 200 at a glance:
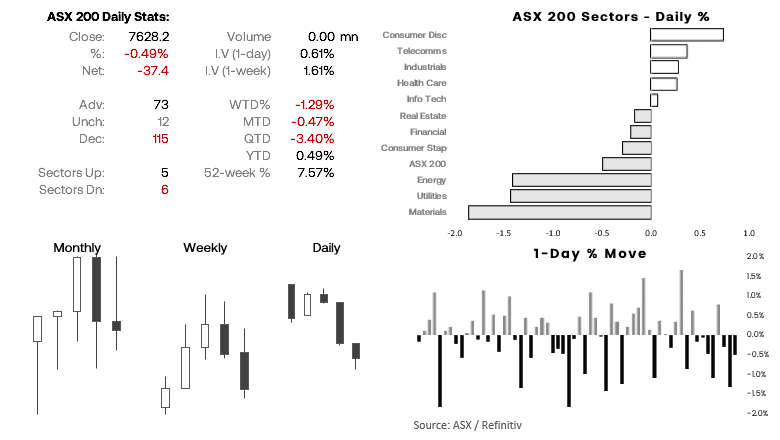
- 7 of the last 8 days have been losses for the ASX 200 (the last 3 days have also been lower)
- The ASX 200 is on track for a second bearish week and month
- Perhaps this points to some overdue mean reversion higher to prompt a bounce

ASX 200 futures (SPI 200) technical analysis:
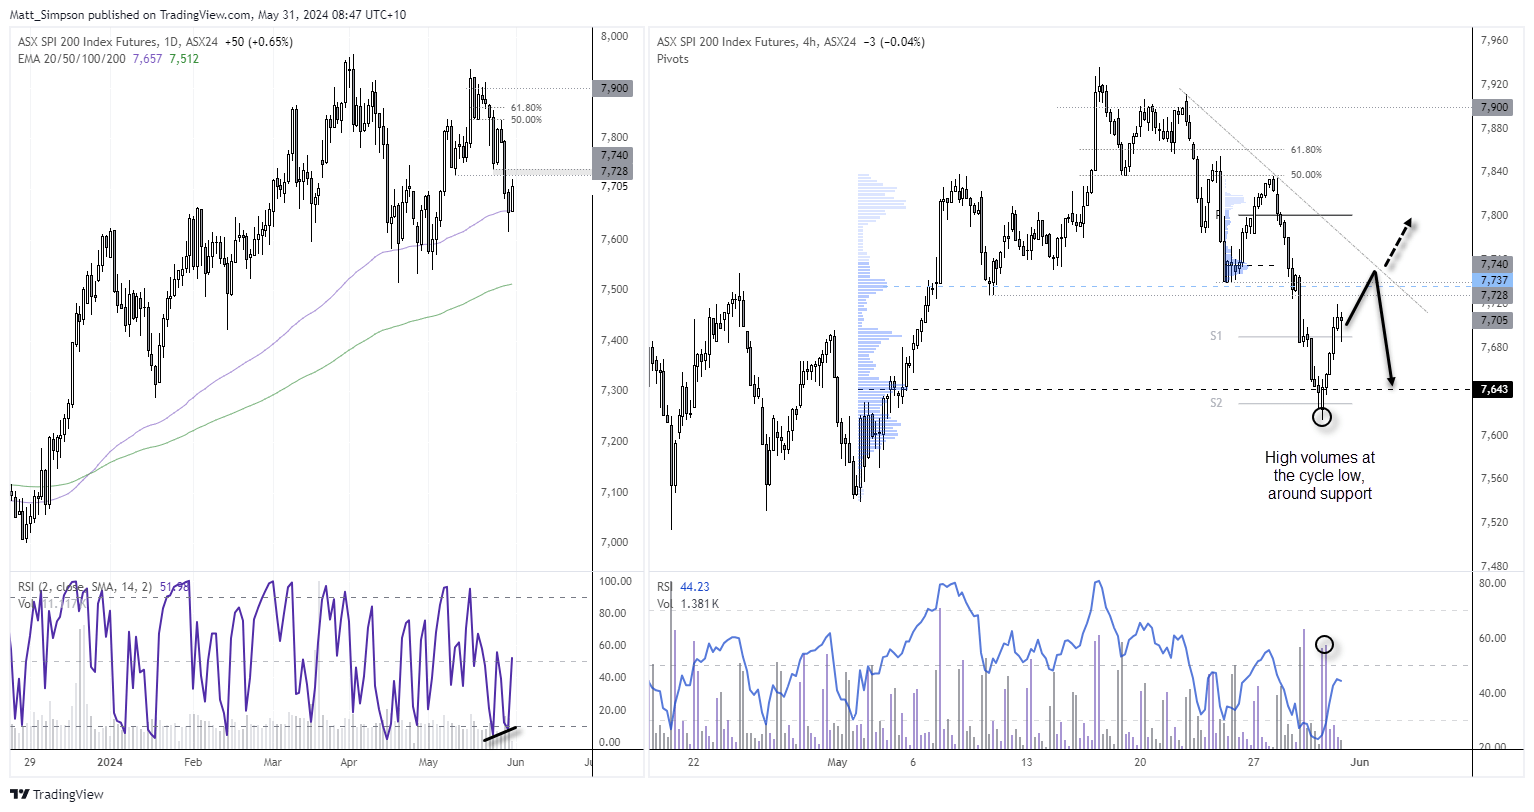
The daily chart shows that the ASX 200 futures market found support around the 100-day EMA on Thursday before reverting higher overnight. A bullish divergence has also formed on the daily RSI (2) within the oversold zone. Odds seem to favour at least another leg higher towards the 7730/40 resistance zone over the near-term.
The 1-hour chart shows heavy volumes at the cycle low, near the weekly S2 pivot point. Prices have since recovered back above the weekly S1 pivot which is now provide support.
Today’s bias is for a move towards trend resistance / 7340 area. Whether it can break higher or simply roll over is likely down to sentiment towards Wall Street and the outcome of the PCE report released later (hot inflation figures likely send indices lower, whereas a weak set of figures could be bullish for sentiment).

Economic events (times in AEST)
- 09:30 – Japan’s CPI
- 11:30 – Australian housing credit (ABS)
- 11:30 – China’s PMIs (NBS)
- 12:00 – New Zealand annual budget release
- 15:00 – Japan’s construction orders
- 19:00 – European CPI
- 22:30 – US PCE inflation
- 22:30 – Canada’s GDP
View the full economic calendar
-- Written by Matt Simpson
Follow Matt on Twitter @cLeverEdge
How to trade with City Index
You can trade with City Index by following these four easy steps:
-
Open an account, or log in if you’re already a customer
• Open an account in the UK
• Open an account in Australia
• Open an account in Singapore
- Search for the market you want to trade in our award-winning platform
- Choose your position and size, and your stop and limit levels
- Place the trade


