


US yields and the dollar were lower on Tuesday as US retail sales came in softer than expected. Odds of a September cut rose to 61% from 56% ahead of the data and up from 46% one week ago – before last week's FOMC meeting. As a reminder, the Fed is veering towards one rate cut in 2024, which markets clearly interpret as September, even though the narrative coming from Fed members seems to be December. Pricing now suggests an 87.2% chance of a cut by December.

The RBA held rates at 4.35% as widely expected, although the statement was perceived to be more hawkish as it highlighted the concerns over inflation being a bigger upside risk. Inflation is "proving persistent," and they only discussed holding or hiking rates, not cutting. This now places a greater emphasis on next week's monthly CPI report and leaves the Australian dollar to tailwinds should it come in hotter as expected (particularly the services component). The same could be said for flash PMI data this week, where traders will keep a close eye on prices paid for underlying inflationary pressures.
AUD/USD was the strongest major, rising in line with yesterday's bias. USD/CHF was the weakest major on Tuesday, breaking key support around 0.8890 and falling to a 3-month low. USD/JPY was also lower in line with yesterday's bias, raising the odds that a topping formation could be in the making.
AUD/USD squeezing higher as RBA tone shifts more hawkish
Nvidia (NVDA) has become the most valuable stock in the world after a near 600% rally since 1999. Still, the Nasdaq only rose 0.03%, notching up its seventh daily record high in a row and leaving a narrow-ranged doji (indecision candle) at the highs. The S&P 500 rose 0.25% to a record high, but again volatility was on the low side, showing a lack of enthusiasm from bulls.
Nikkei futures rose for a second day, although I remain skeptical of runaway gains and continue to seek evidence of a swing high for a swing trade short. Hang Seng and China A50 futures were up slightly overnight and look more constructive for potential long swing trades.
China A50 could be teeing up for a rebound, Nikkei 225 remains trapped
WTI crude oil rose for a third day and closed above $80 due to rising geopolitical risks across Europe and the Middle East, with the latter being a threat to global supply. $81 is the likely resistance level for bulls test today, and the 1-hour trend remains bullish above the $79.21 low.
Economic events (times in AEST)
- 09:00 – Japan business sentiment (Reuters Tankan)
- 09:50 – Japan trade balance, monetary policy minutes
- 11:.30 – RBA chart pack
- 16:00 – UK inflation
- 15:30 – Monetary policy assessment

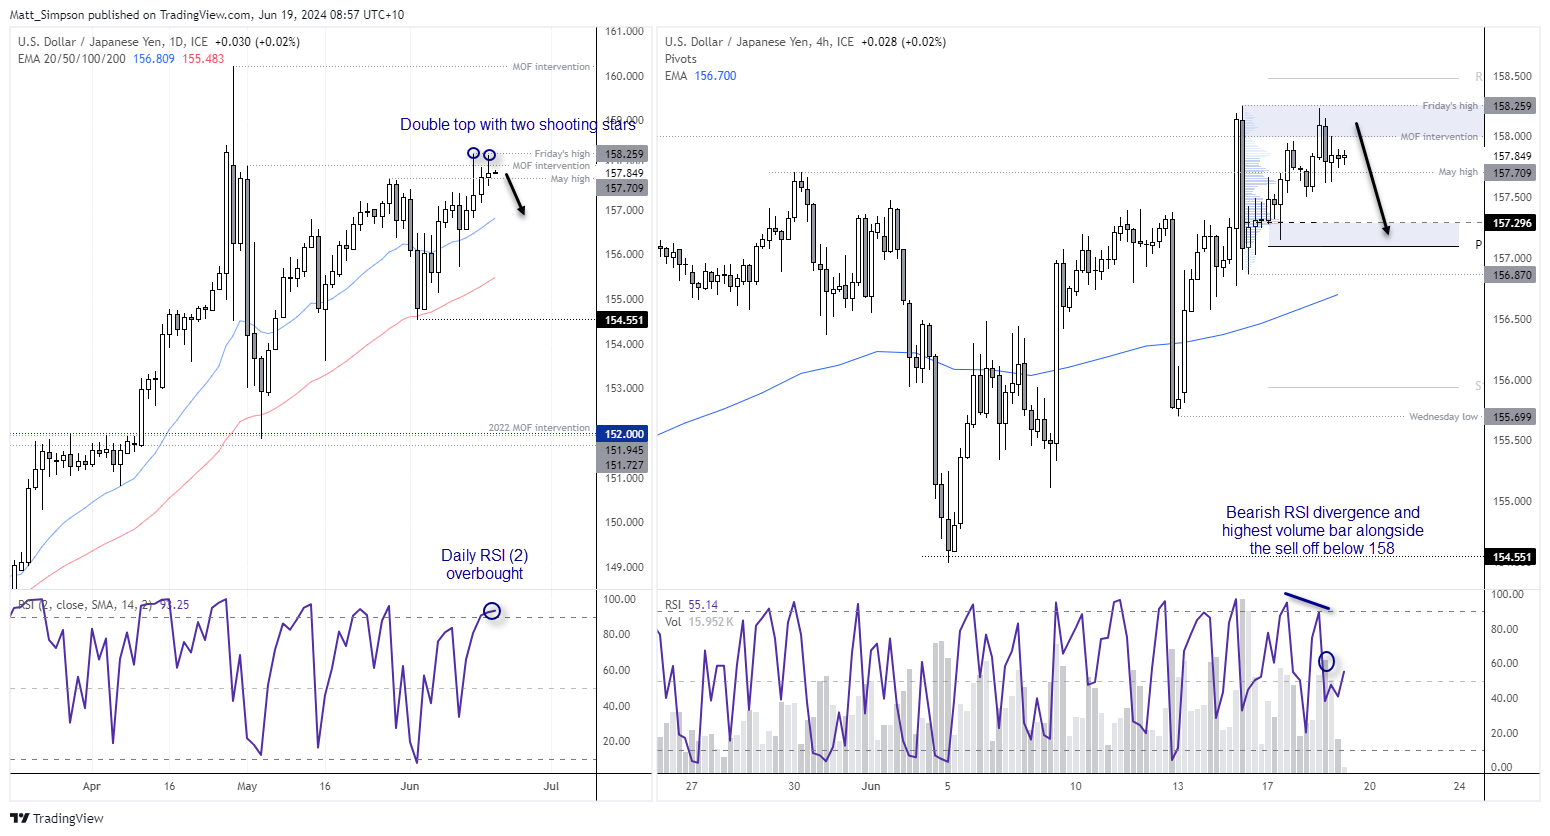
USD/JPY technical analysis:
Twice over the past two days, we have seen USD/JPY break – yet fail to close above – 158. Which is what I warned of on Friday after the BOJ's meeting. And with US data beginning to roll over, a case for USD/JPY to top out could be building. A small shooting star formed on Tuesday, making it the second over three days and a double top around 158.30.
The 4-hour chart shows that prices are coiling within a tighter range below the MOF intervention high. A bearish RSI divergence has formed, and the highest volume of yesterday landed on the large bearish candle near the highs of the day. Therefore, the bias remains to fade into rallies towards the MOF intervention high, with 157.50 and 157.30 becoming the next downside targets for bears.
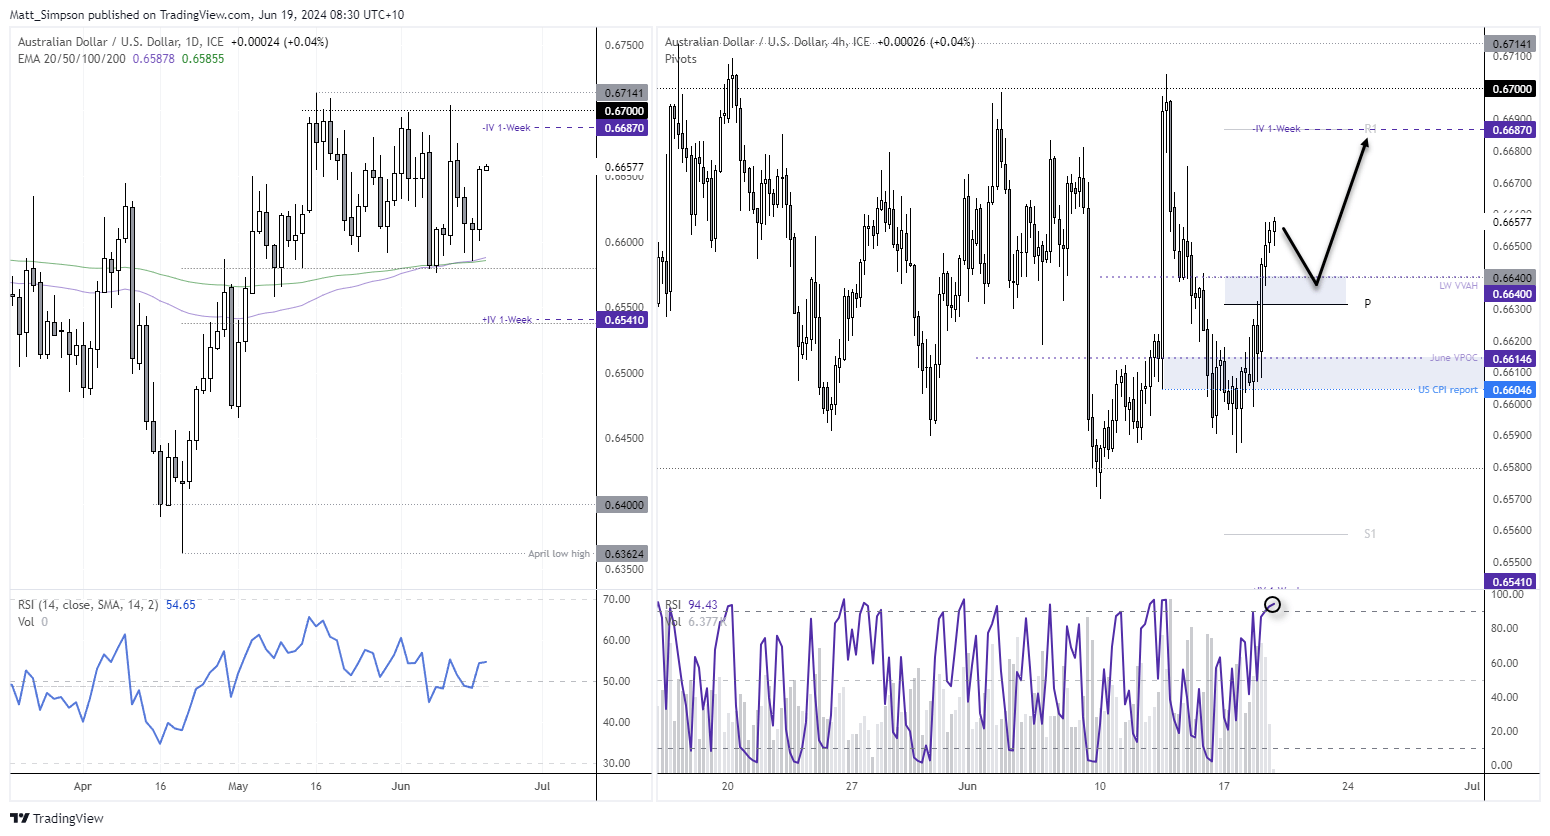
AUD/USD technical analysis:
The Australian dollar snapped a 3-day bearish streak thanks to soft US retail sales and a relatively hawkish RBA statement, further cementing support around the 100/200-day EMA. This has taken prices within the top half of the 0.6580 – 0.6700 range and shows the potential for further upside with some minor pullbacks along the way.
The 4-hour chart shows that Tuesday’s rally was accompanied by strong volumes, so whilst RSI (2) has reached overbought, I'm hoping it can provide another opportunity for bulls to reload at more favourable (lower) prices. Last week’s volume value area high (LW VVAH) sits around 0.6640, and the weekly pivot at 0.6630 are both levels which could potentially provide support for a swing low ahead of an anticipated move towards the top of the range around 0.6700.
View the full economic calendar
-- Written by Matt Simpson
Follow Matt on Twitter @cLeverEdge
How to trade with City Index
You can trade with City Index by following these four easy steps:
-
Open an account, or log in if you’re already a customer
• Open an account in the UK
• Open an account in Australia
• Open an account in Singapore
- Search for the market you want to trade in our award-winning platform
- Choose your position and size, and your stop and limit levels
- Place the trade
Latest market news
Yesterday 02:00 PM
June 28, 2024 01:50 PM
June 28, 2024 12:19 PM
June 28, 2024 12:00 PM
June 28, 2024 11:02 AM
June 28, 2024 05:46 AM
Latest Asian Open articles

June 27, 2024 10:56 PM
June 19, 2024 11:37 PM

June 18, 2024 11:35 PM

June 17, 2024 10:58 PM