


H2 2024 Equities Forecast: SPX, Nasdaq, Dow and DAX
Equities Forecast for Q3, 2024 – Talking Points:
- In the Q2 Forecast I warned of pullback potential, and that appeared on the first day of the quarter after the S&P 500 set a fresh all-time-high and then proceeded to sell-off.
- I had also highlighted the fact that a dovish Fed and active Treasury department would likely to try to soften the blow via rates, and that also took place, which helped to propel both the S&P 500 and Nasdaq 100 to fresh all-time-highs.
- Notably, the Dow and Russell 2000 have lagged, highlighting bifurcation in US equity markets as the AI-trade drives ahead.
Stocks Shake Off Q2 Pullback
It was another strong quarterly outing for both the S&P 500 and Nasdaq despite a turbulent start to Q2. As I had highlighted in last quarter’s forecast, there was an open door for a pullback scenario and that started to play out very soon after the calendar flipped into Q2. And for a few weeks, equities were looking to be quite vulnerable, with S&P 500 futures pulling back to test below the 5k psychological level.
But the May 1st rate decision from the FOMC brought a familiar dovish refrain and that helped bulls to get back in the driver’s seat. And then a banner earnings announcement from NVDA tilted the attention back on to the AI-theme, which helped to drive both the S&P 500 and Nasdaq to fresh all-time-highs, and that has largely continued through June trade. Notably, the Dow has lagged behind as there is no NVDA in the index, and this highlights an element of bifurcation that may soon become of interest.
But as the door opens into Q3 the Fed has some optionality after reducing rate cut forecast at their most recent rate decision. And this enables them to take a dovish twist at some point in Q3 to help keep equities bid, and they can do this without having to actually reduce rates.
One of the items that highlighted pullback potential as we came into Q2 was outperformance in the S&P 500 while the tech-heavy, higher-beta Nasdaq lagged. In a true expansionary environment, normally, we’ll see the riskier stocks (which present a higher risk-reward type of scenario) with a stronger bid; but that wasn’t the case last quarter. It is the case right now, however, as Nasdaq futures are reaching to fresh highs to a greater degree than the S&P 500.
As we move into Q3 bulls remain in control of both the S&P 500 and Nasdaq, and with the Fed retaining some optionality by going a bit more-hawkish in the June SEP, any bouts of weakness could likely be offset through by Fed-speak and a more dovish lean from the FOMC.
S&P 500 Outlook
The S&P 500 had a turbulent open to Q2, but that showed after an extended bullish run that had developed around the November FOMC rate decision. It was at that meeting that the Fed sounded more-dovish than they had in the past, and this was after prior pledges from Powell that the base case from the Fed for the US economy was no longer expecting a recession.
The pullback lasted all of three weeks and marked a 23.6% retracement of the bullish trend that started in 2022 and ran into the first day of Q2 trade. We’ve already seen the 127.2% projection of the pullback come into the equation, which is confluent with the 5,500 level. The 161.8% extension of that move plots at 5627, and this provides an overhead resistance level for bullish continuation scenarios. After that, 5750 is a notable psychological level and in the bullish scenario, I think that could come into play at some point in Q3.
Notably, there was stall showing in late-May and through early-June, so the bullish breakout is still rather fresh. This also highlights the fact that prior resistance needs to remain intact or else bulls risk losing control, which could develop into a deeper pullback. But, if that takes place there may be more amenable venues for equity weakness, such as the Dow which I’ll look at in a moment.
S&P 500 Futures – Weekly Chart
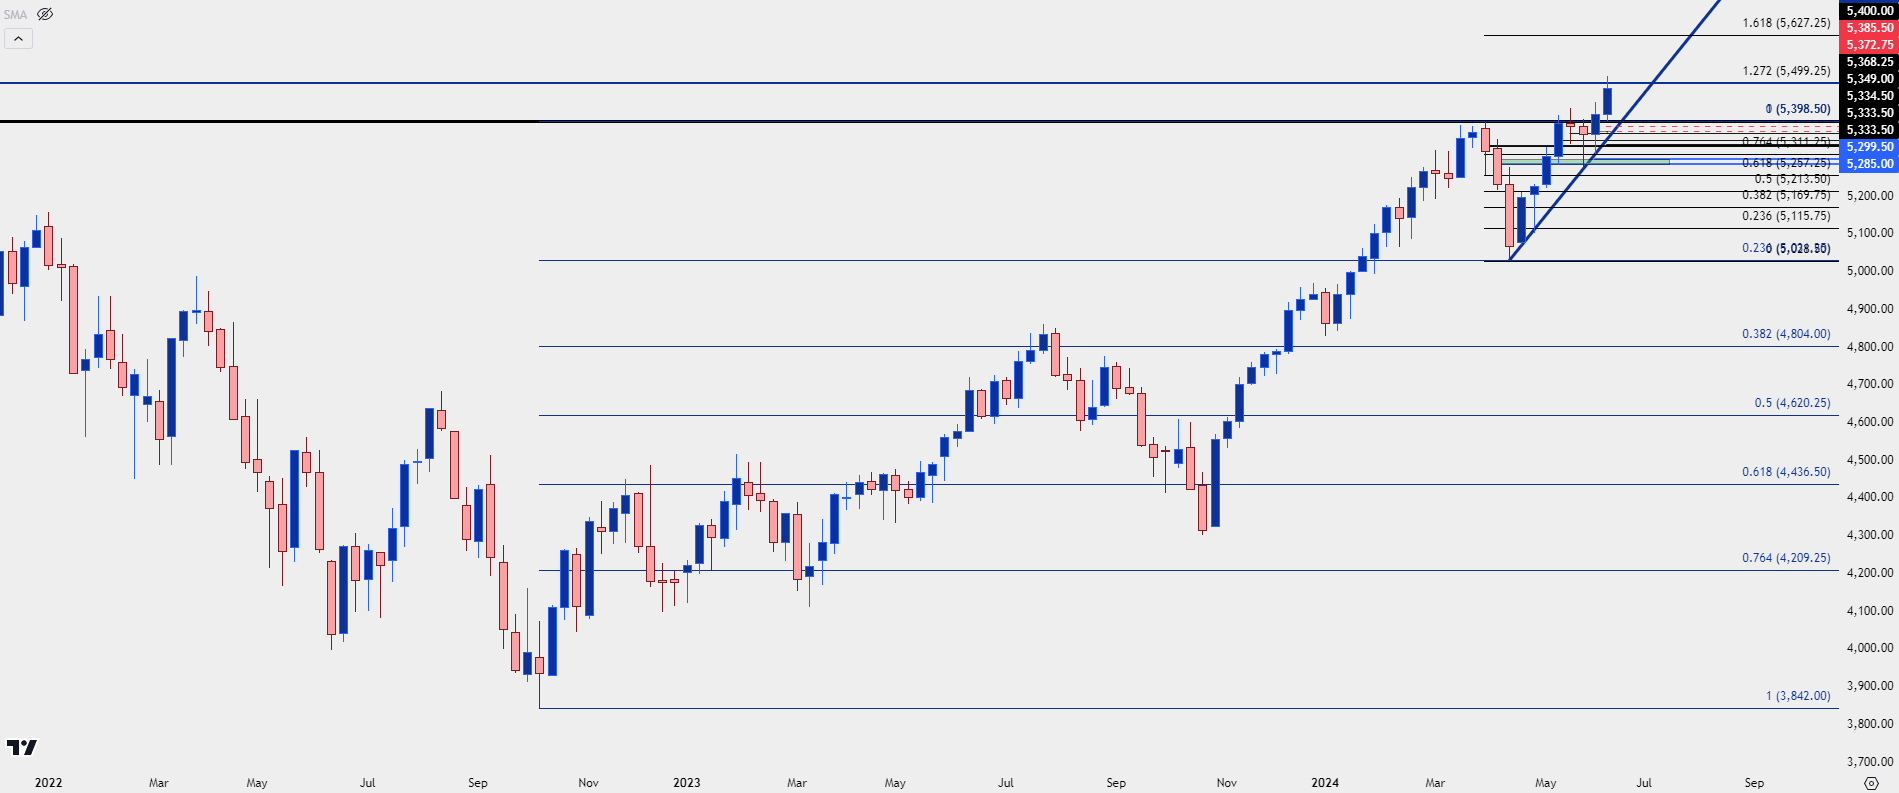
Chart prepared by James Stanley; data derived from Tradingview
Nasdaq 100 Outlook
Coming into Q2 there were two bearish formations setting up in the Nasdaq 100. The first was a rising wedge and the second, more prominent formation was a double top.
The double top formation remained intact on the first day of Q2 trade, even as the S&P 500 set a fresh all-time-high, which illustrates the divergence mentioned earlier. That is not the case today, however, and as of this writing, the Nasdaq has rallied by a whopping 14.46% from those April lows, while the S&P 500 is up a more modest 9.08%.
The April low formed just after the double top formation had completed and there was a stark change-of-pace in the market as we moved into the May open, helped along by a dovish FOMC meeting on May 1st that was followed by a below-expected NFP print two days later.
This is clear indication of the AI-theme driving US equity markets, and there’s no indication at this point that the theme is nearing completion. As we move towards the election with a very cautious FOMC and a backdrop of falling yields, the argument for strength in tech stocks can remain in-place.
For levels, we’re already breaking fresh ground and the 20k level is already very close by. Current resistance is at the 161.8% extension of the Q2 pullback move and the 20k level is just overhead. This is a major psychological level that could take some time to gain acceptance; but if bulls can mount a move above that, the next focus would be on the 200% extension of the Q2 pullback which plots at 20,560, after which 21k would be the next level to come into the picture.
Nasdaq 100 Futures – Weekly Chart
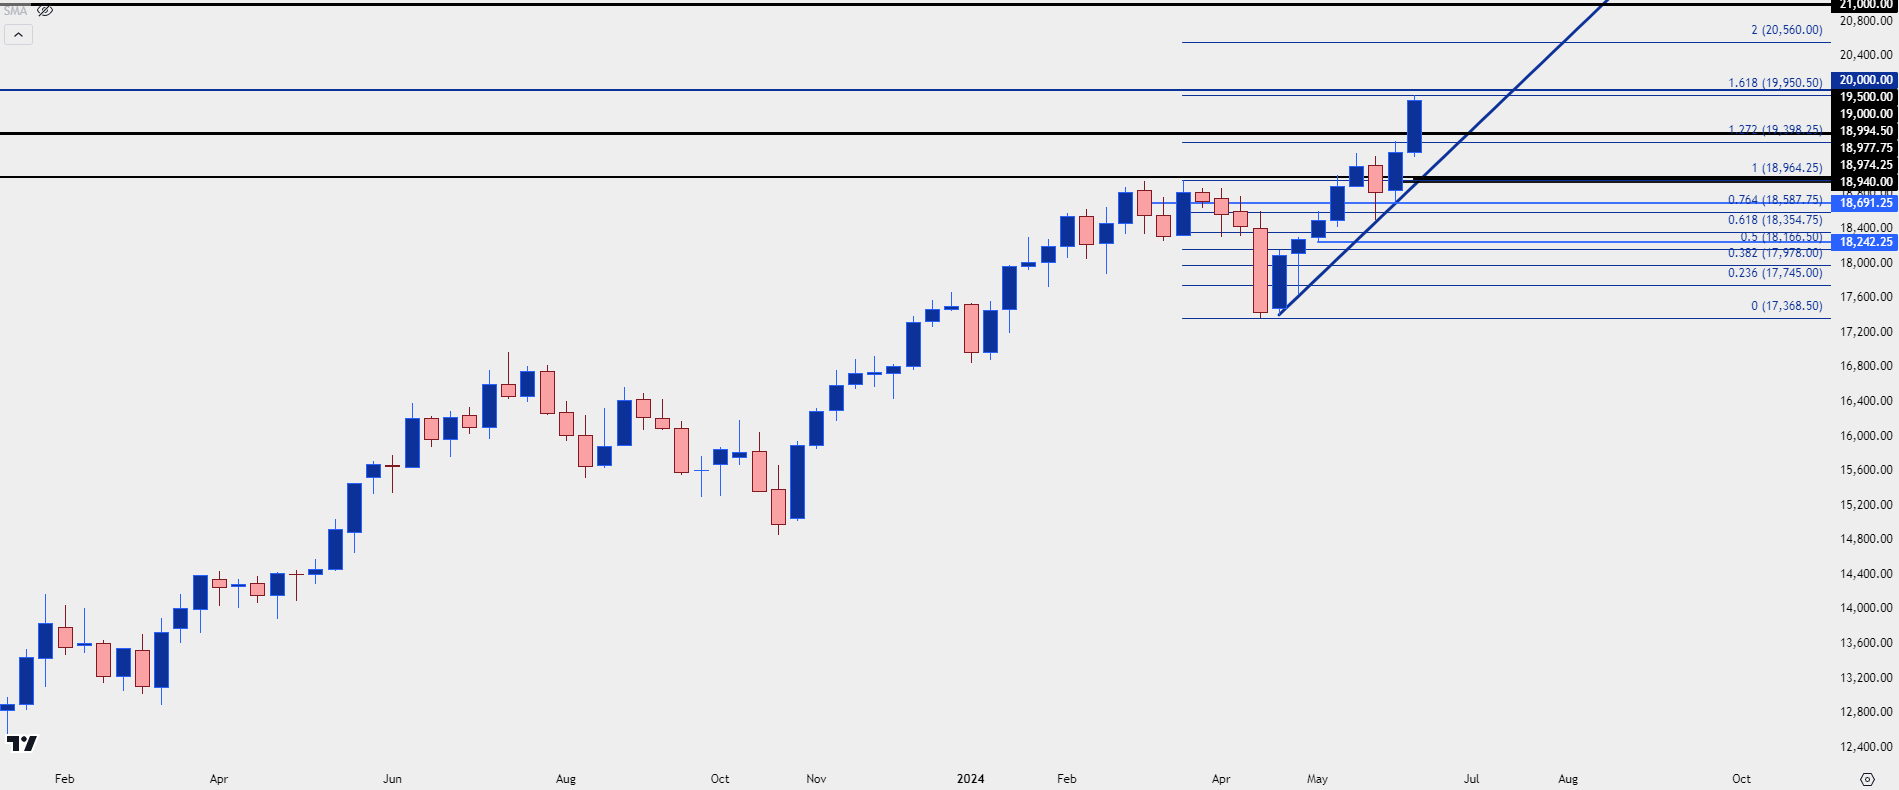
Chart prepared by James Stanley; data derived from Tradingview
Dow Jones Outlook
While the S&P 500 and Nasdaq both trade near freshly-established all-time-highs, the same can’t be said about the Dow, which has continued to struggle with the 40k level that I warned of in the 2024 Forecast.
Q2 saw another test and failure at that level, and in Dow futures, this even entailed a lower-high. The pullback from that did find support at the 23.6% retracement of the Q2 pullback, but the bounce from that has, so far, been mild and offset by sellers defending resistance.
This illustrates the current equity drive fairly well, in my opinion, where the recent rally has very much been an AI-driven scenario. This doesn’t necessarily portend doom and gloom, however, but it does highlight the fact that for those looking at bullish equity scenarios will likely want to stick with the leaders, such as the Nasdaq or perhaps even the S&P 500. And deductively, for bearish equity scenarios, the Dow could be a more attractive venue to follow.
If we do see a pullback develop, there’s a prior spot of resistance at the 37,300 area in Dow futures that remains attractive for support potential, and that would be a major test for the index if it comes into play.
Dow Jones Futures – Weekly Chart
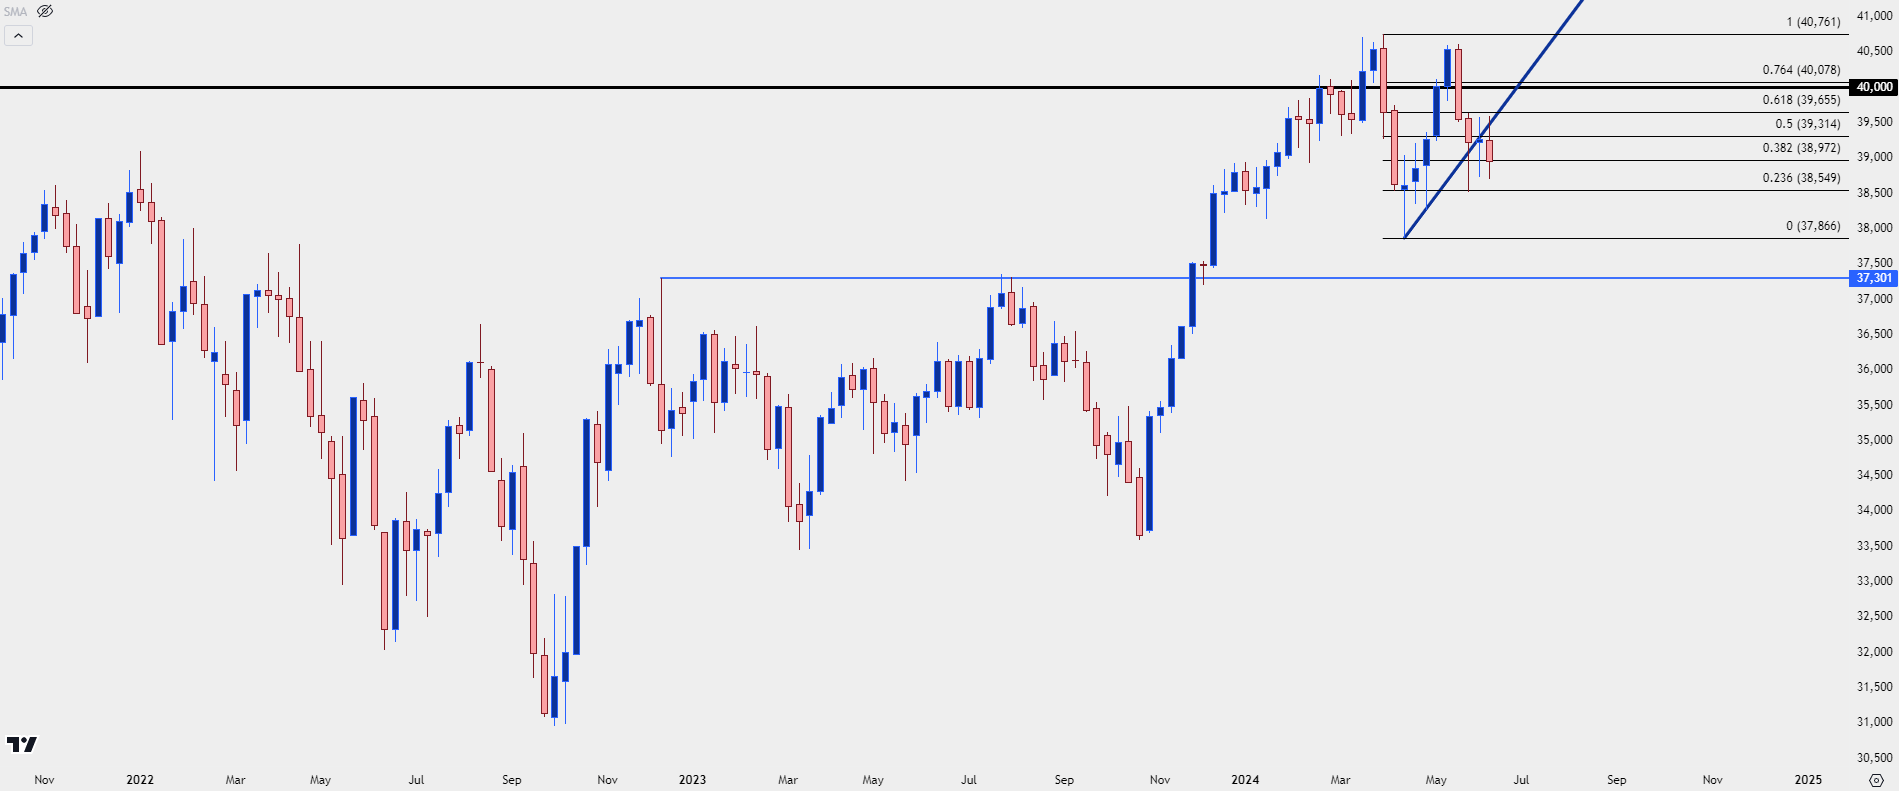
Chart prepared by James Stanley; data derived from Tradingview
DAX Outlook
The European Central Bank kicked off their rate cutting campaign in early-June and the week after saw the largest sell-off in the DAX in more than ten months. There does remain significant bullish structure in-place, however, as the index had kept pace with the US equity rally that started in November of last year.
But, while pricing in rate cuts can be a large benefit for stocks, rate cuts themselves aren’t always a bullish equity driver. The very fact of the central bank lifting rates (and lowering bond yields) means that bond prices move higher, and this can be a point of attraction for traders and fund managers. And if equities are looking vulnerable, the argument to allocate some assets away from stocks and into bonds isn’t a terrible idea. This can lead to softness in stocks and more strength in bonds (and falling yields).
With the ECB, it sounds very much like they don’t want to stick out too far from the Fed so they’ve been evasive around future rate cuts and that could possibly work to the benefit of European equities. There is political risk here, as well, however, and that makes bullish trend continuation approaches a bit more challenging.
In the DAX, there was a significant hold of resistance coming into 2024 trade and, as yet, that zone hasn’t been re-tested for support. If that scenario takes place, it could be seen as a moment of truth as to whether there’s potential for a larger-scale drawdown or whether bulls return to the matter to hold support. I’m tracking that support between the 76.4 and 78.6% Fibonacci retracements of the 2024 bullish move, drawn from the January low up to the May high.
DAX Futures – Weekly Chart
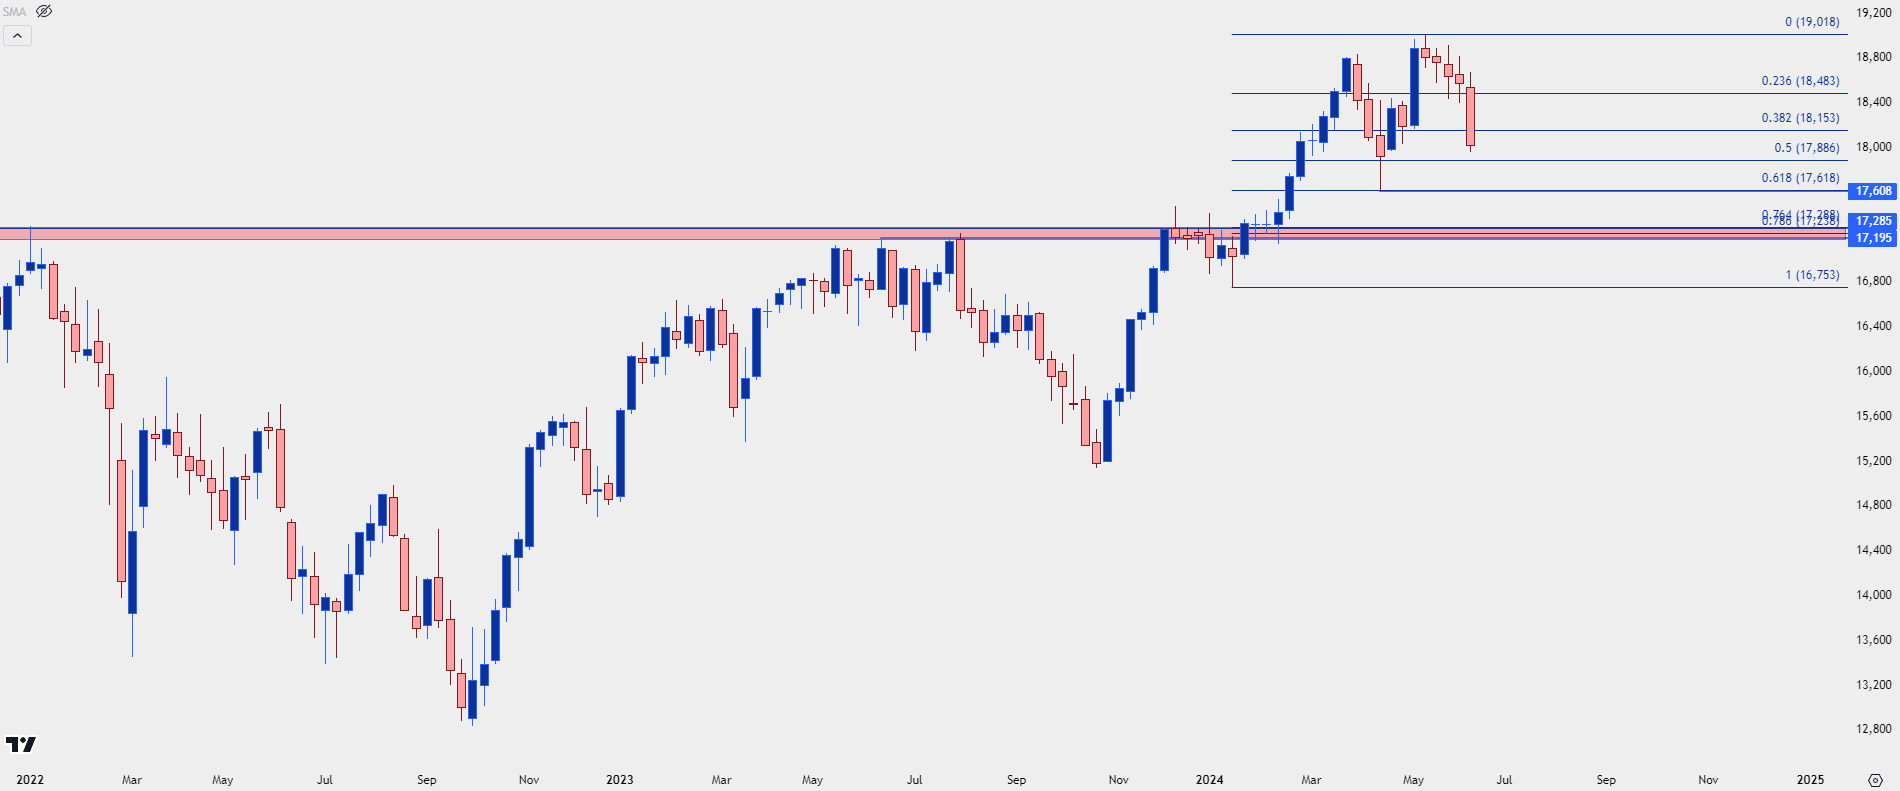
Chart prepared by James Stanley; data derived from Tradingview
